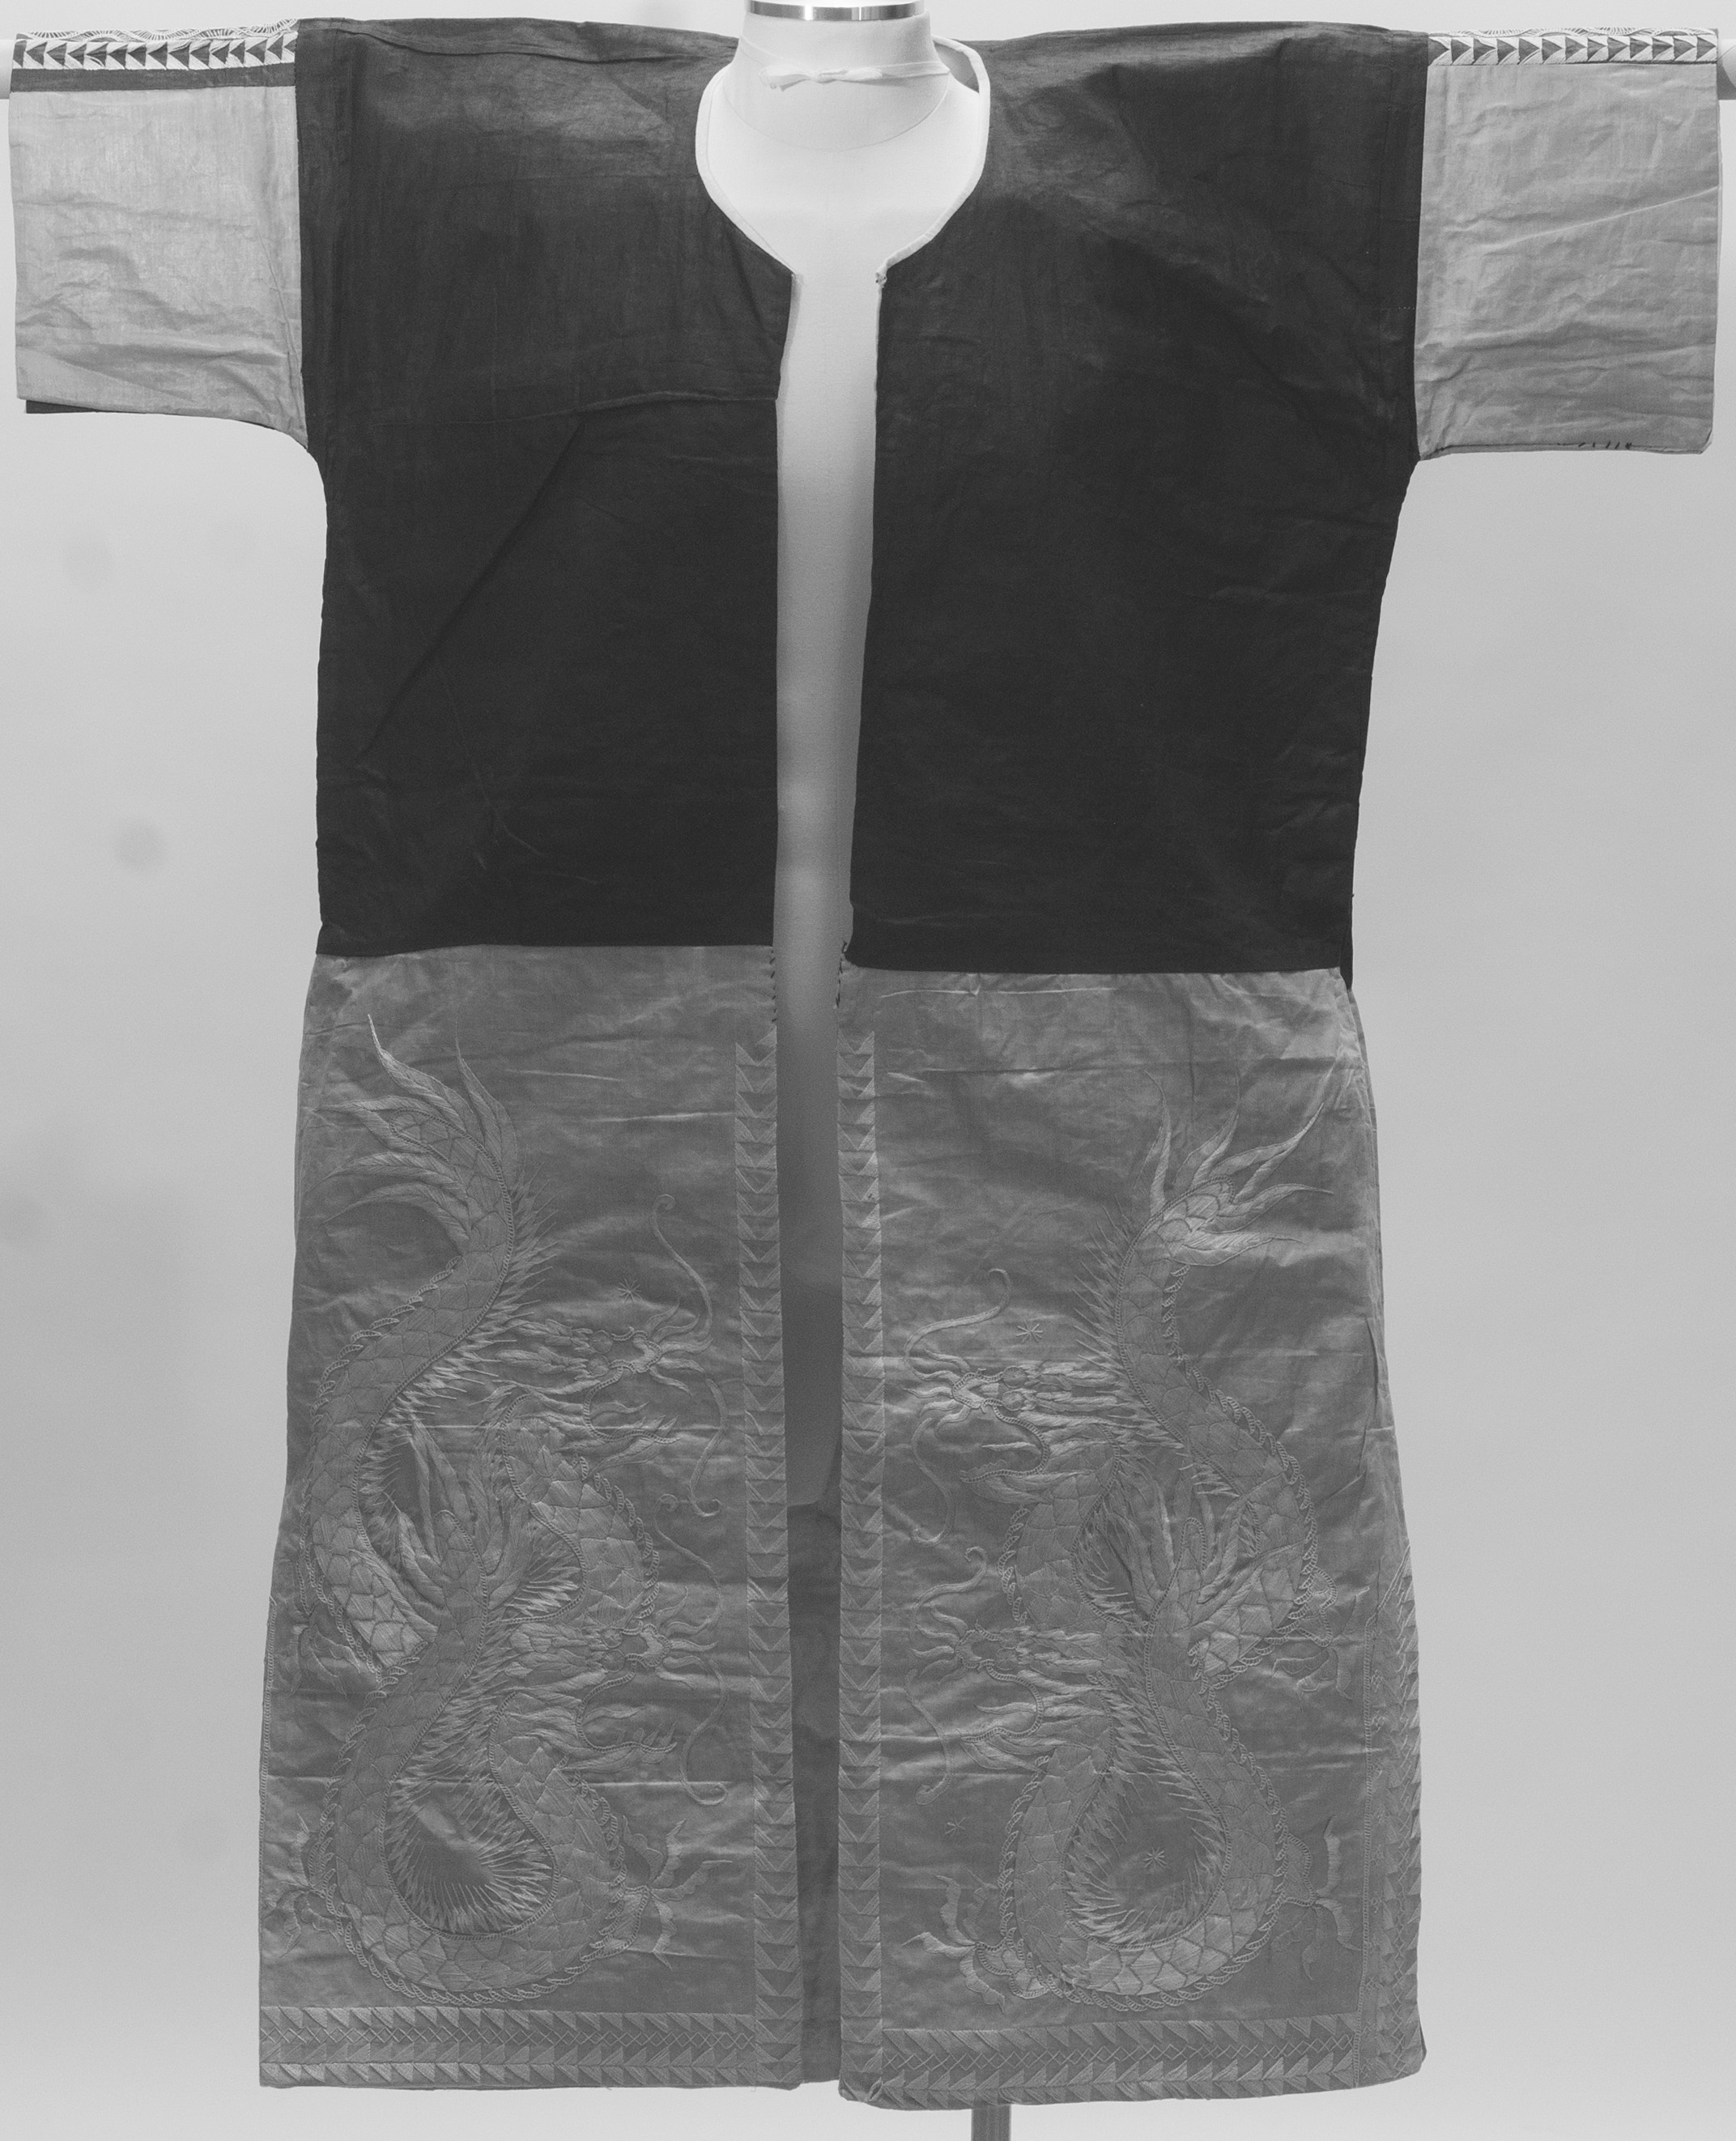
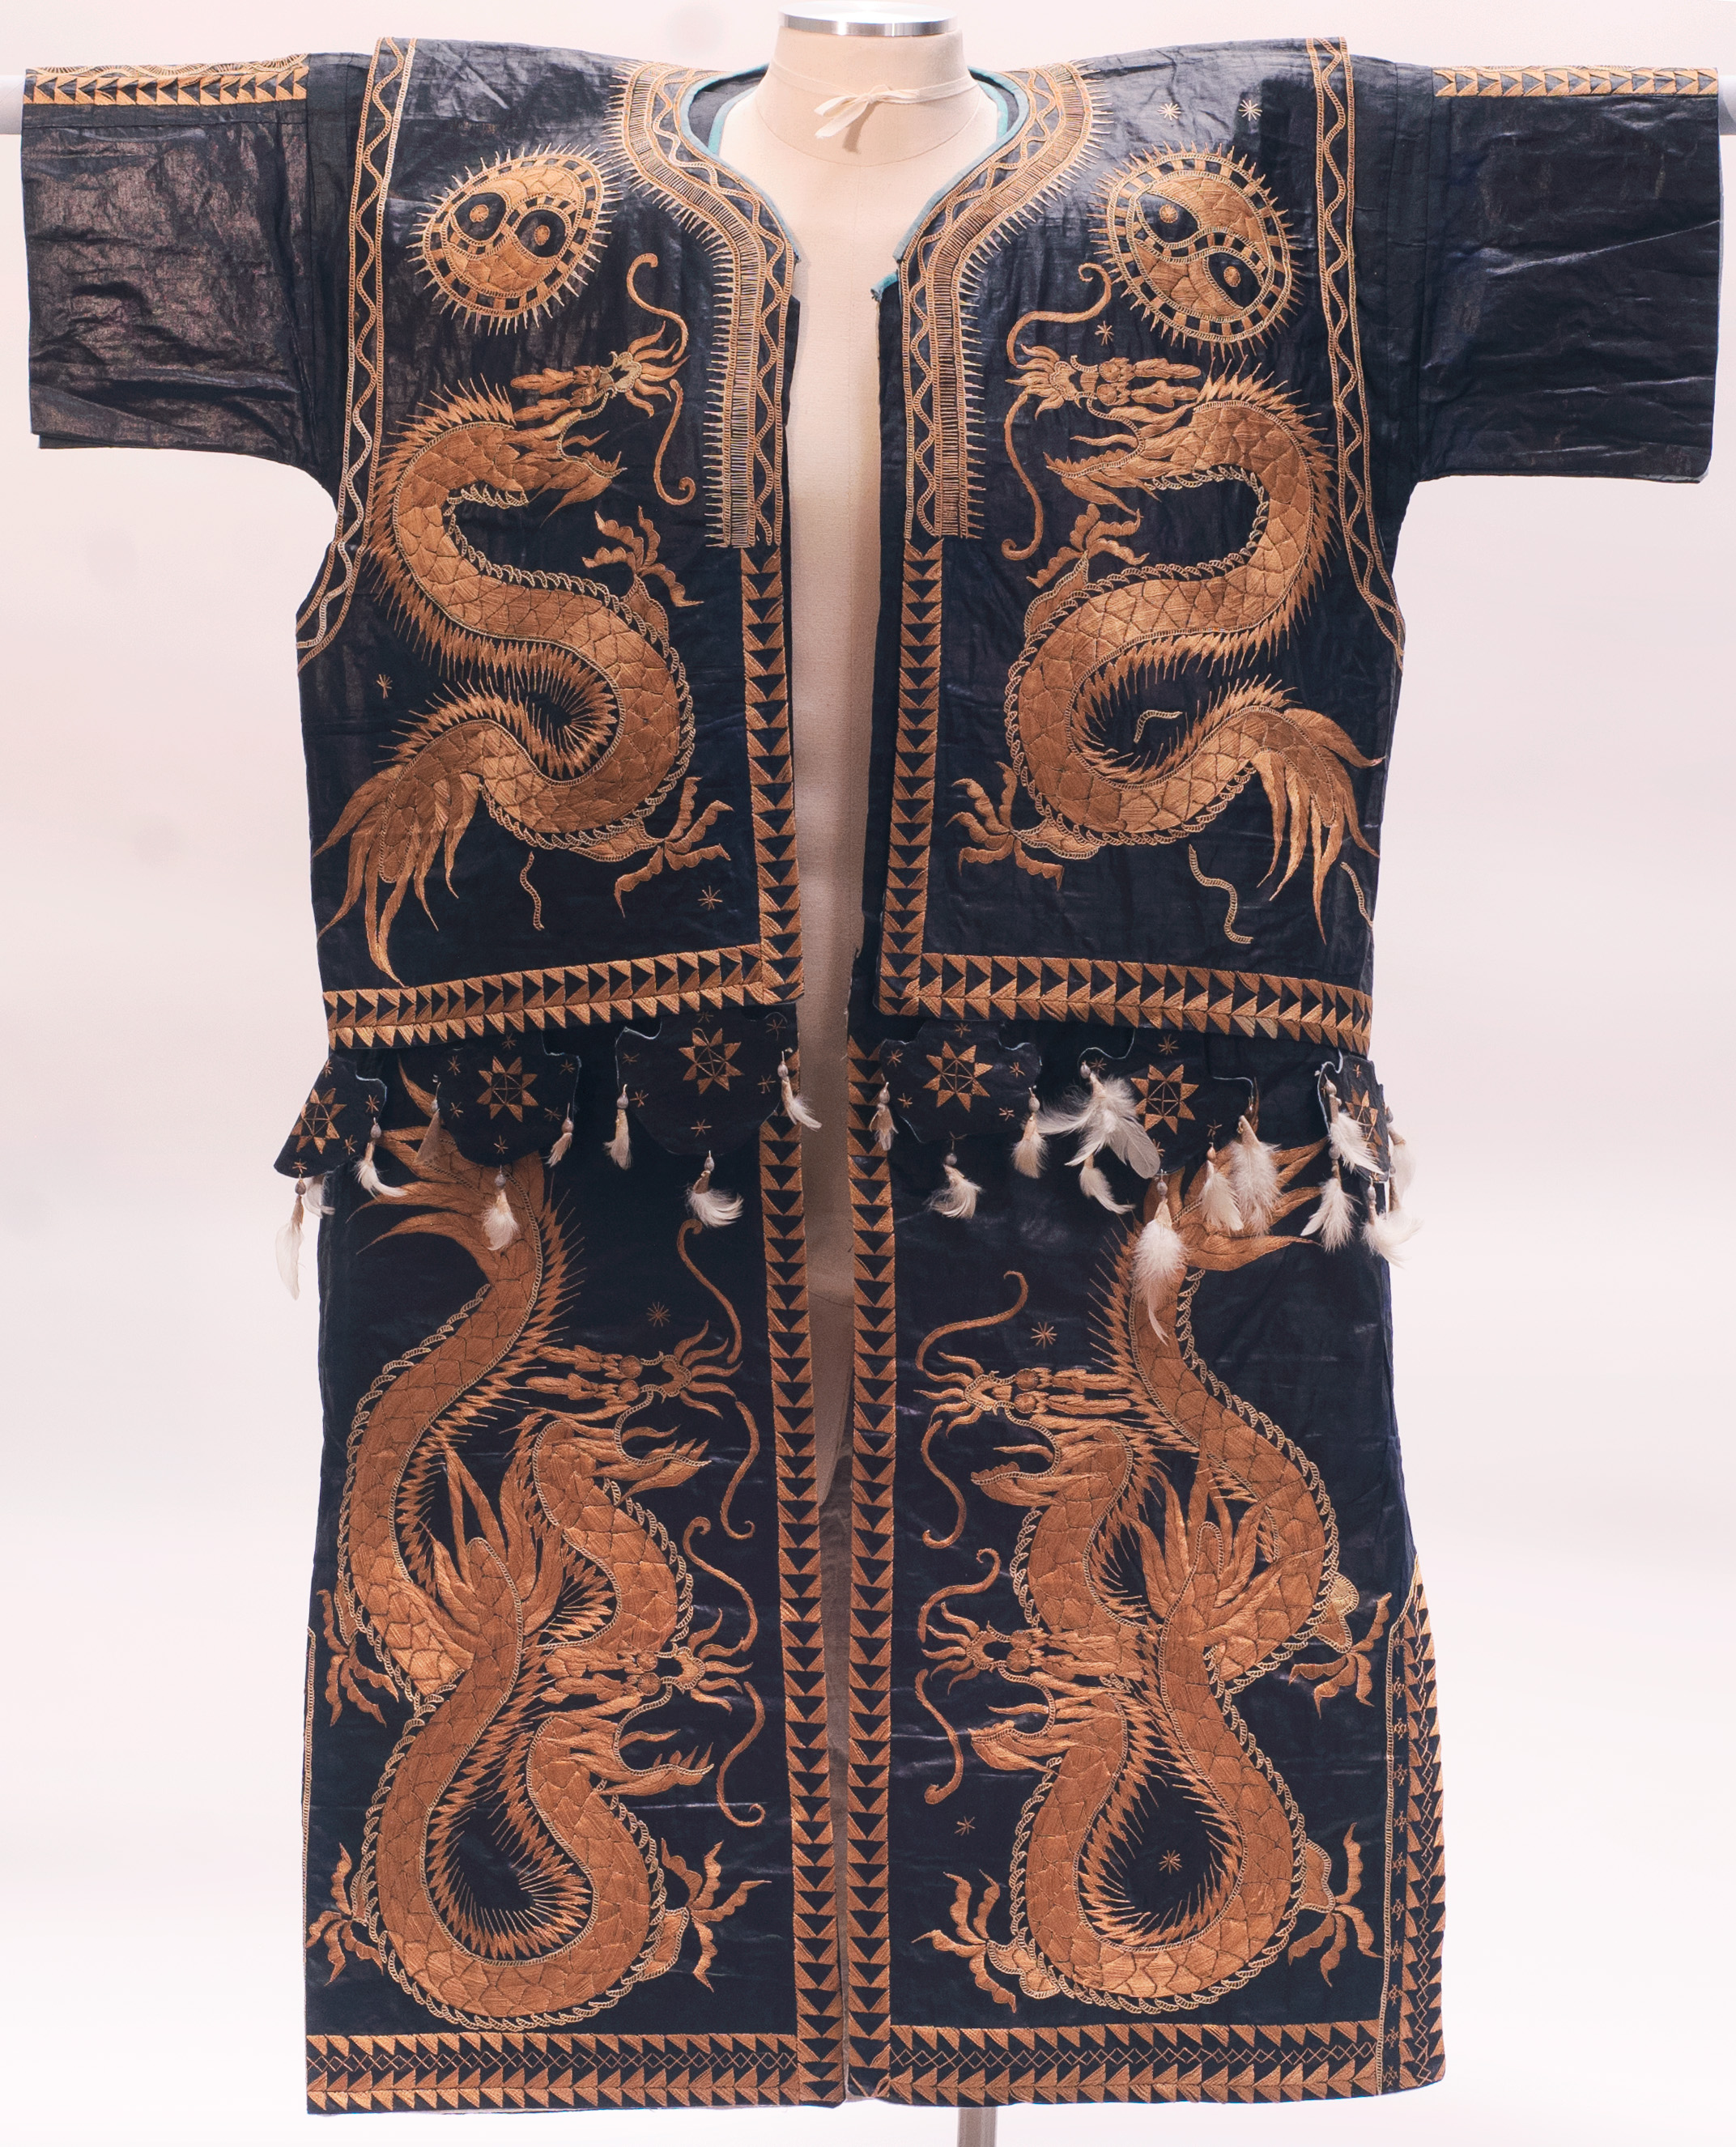
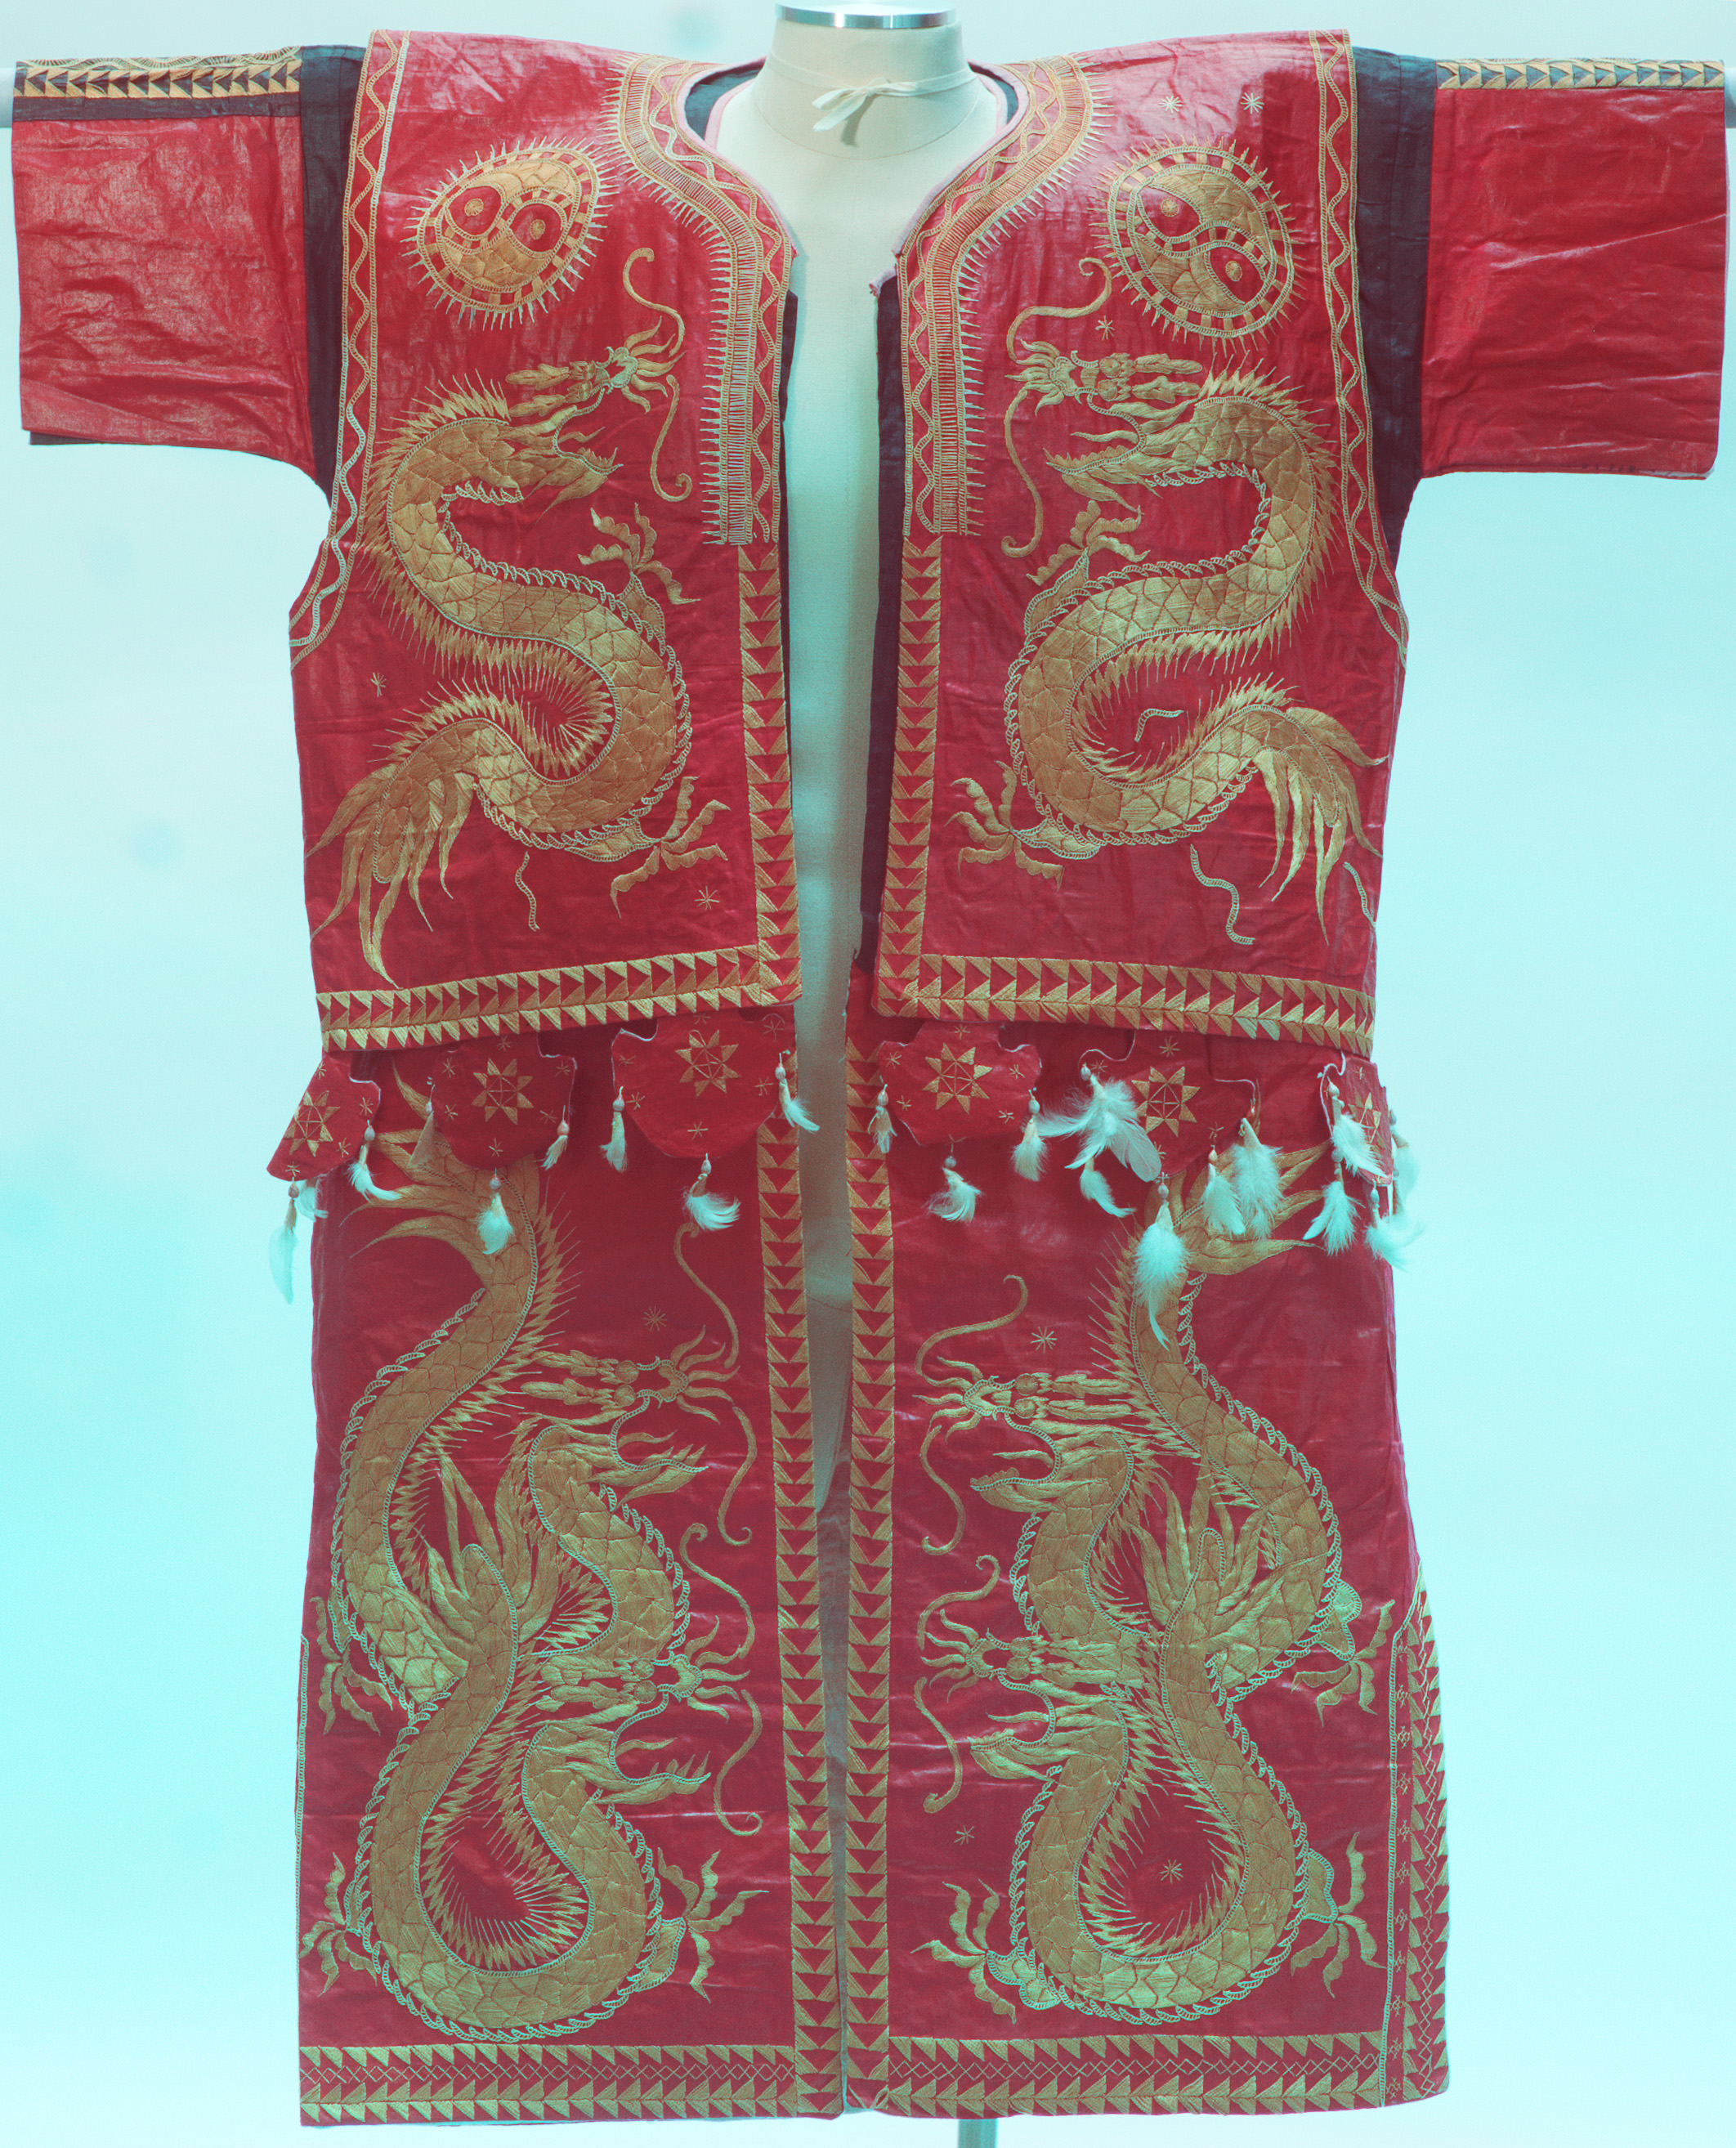
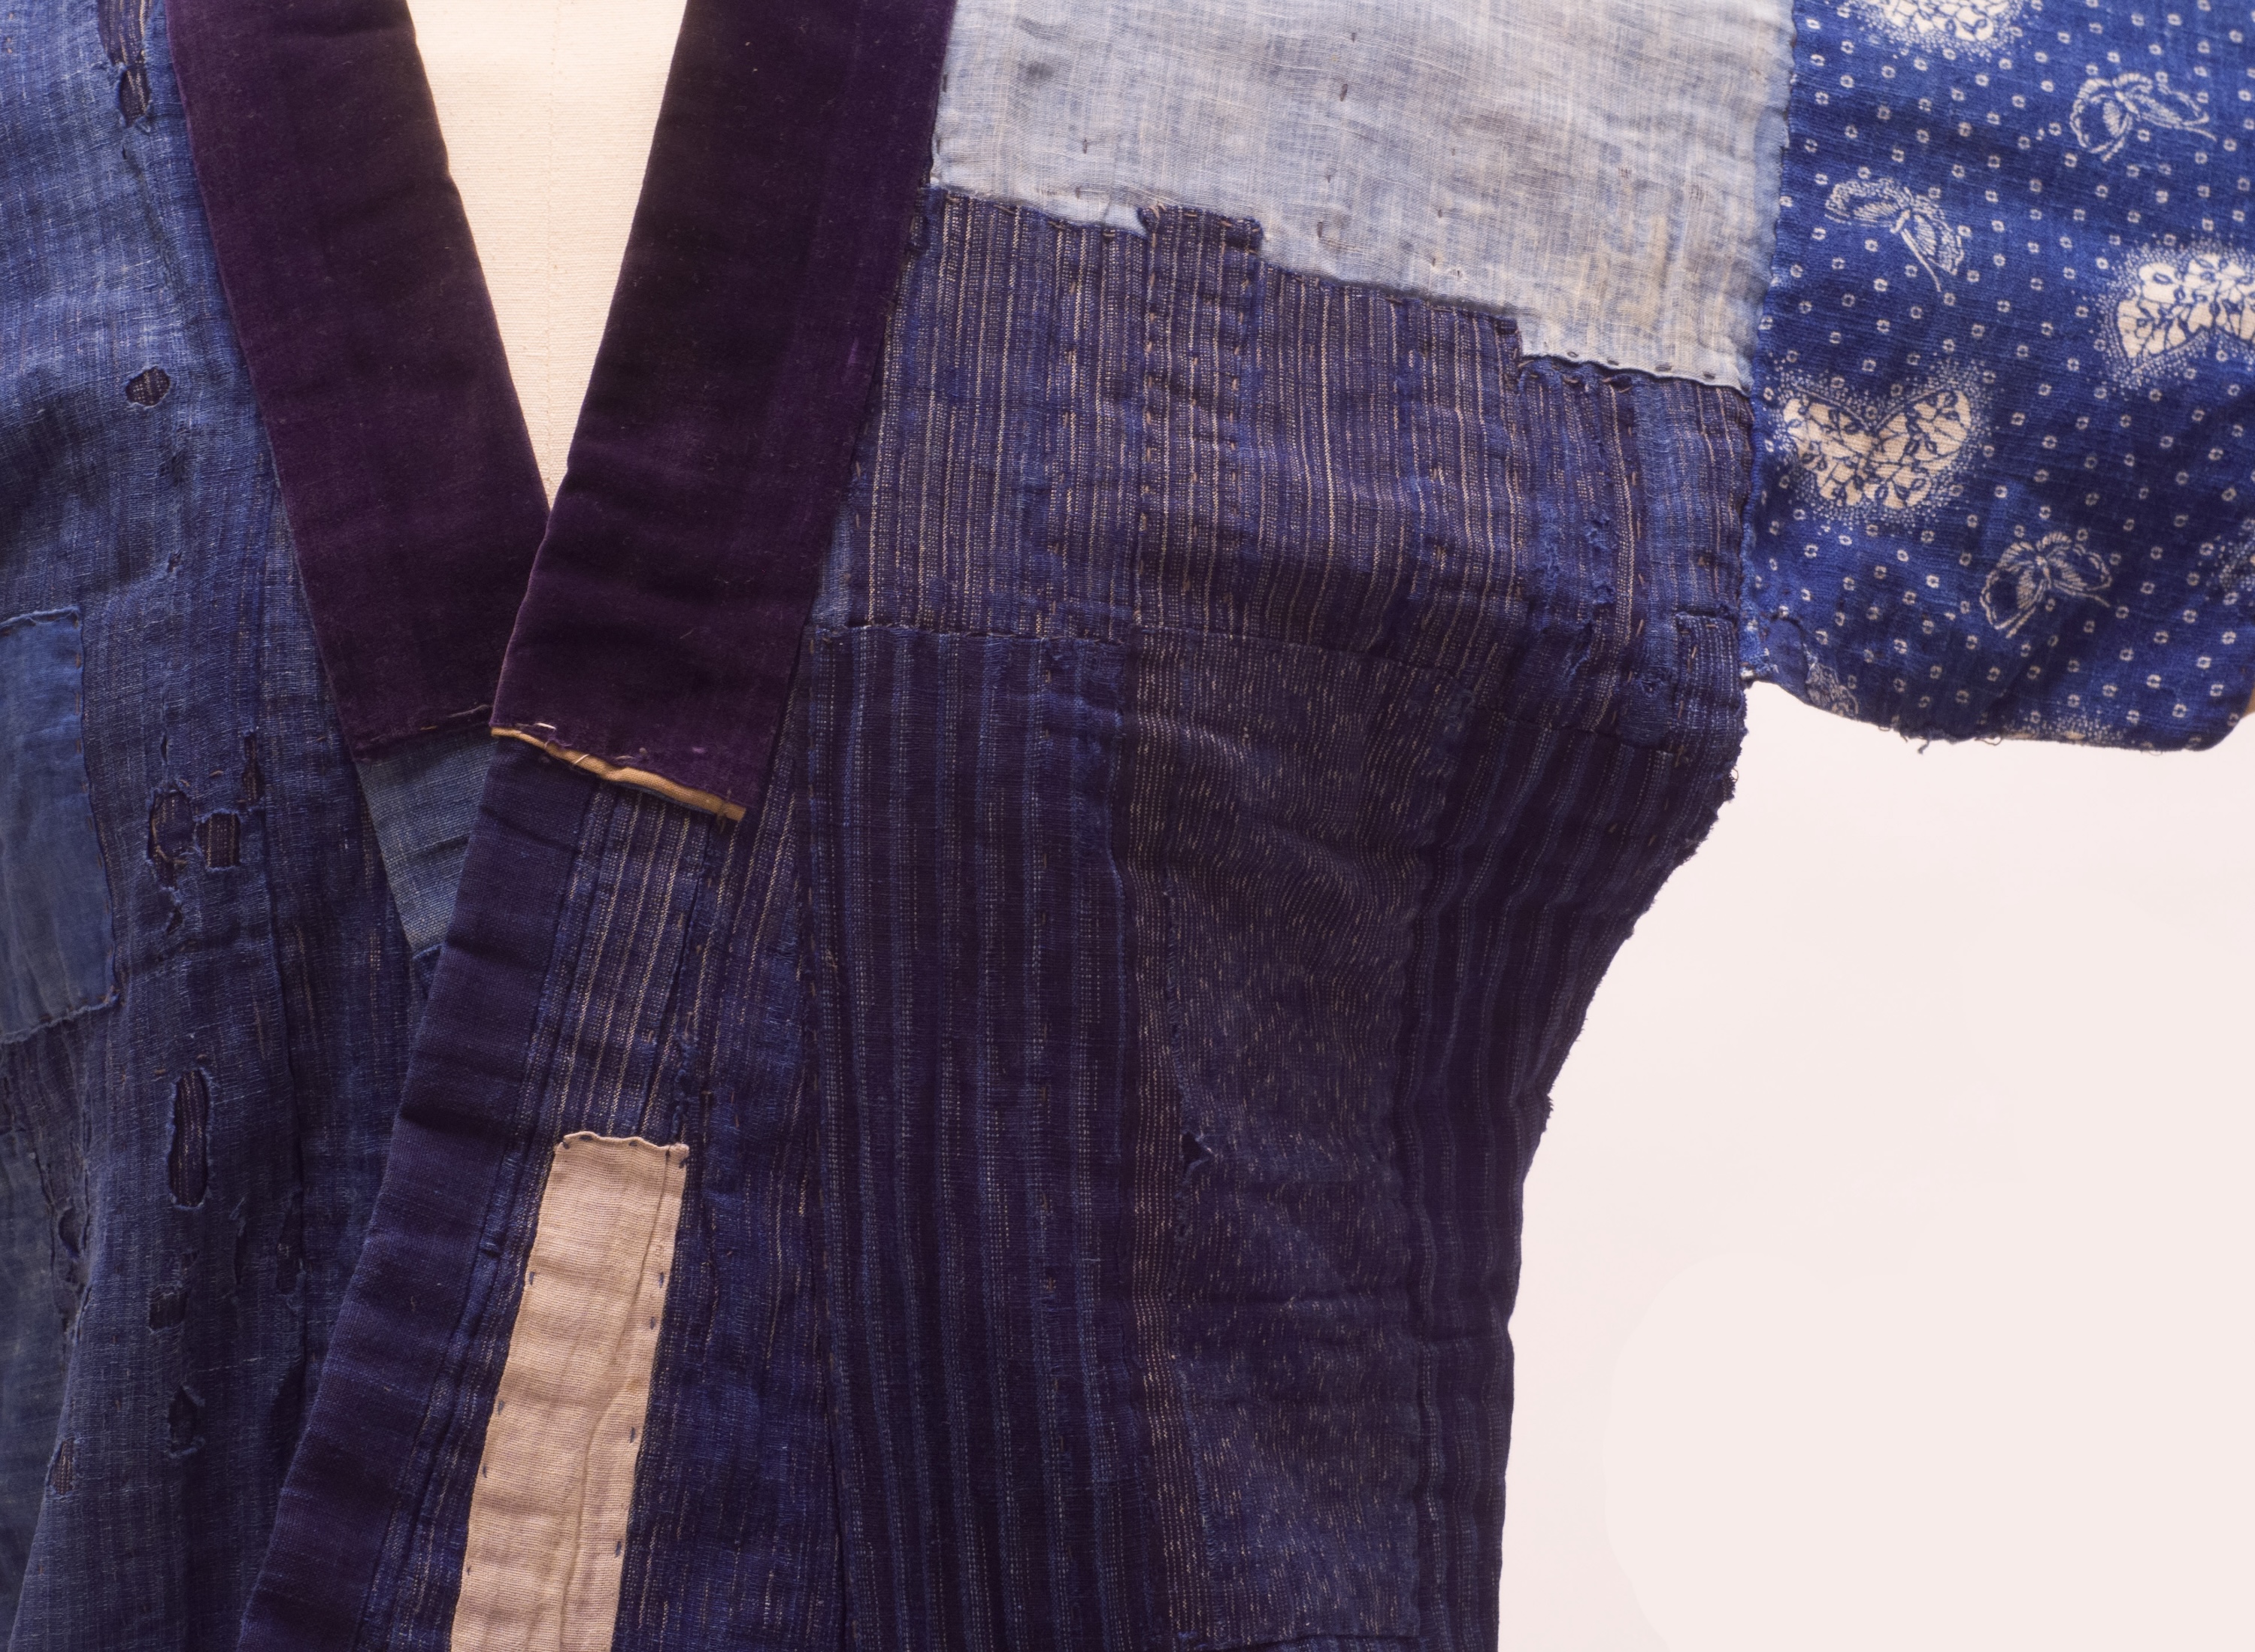
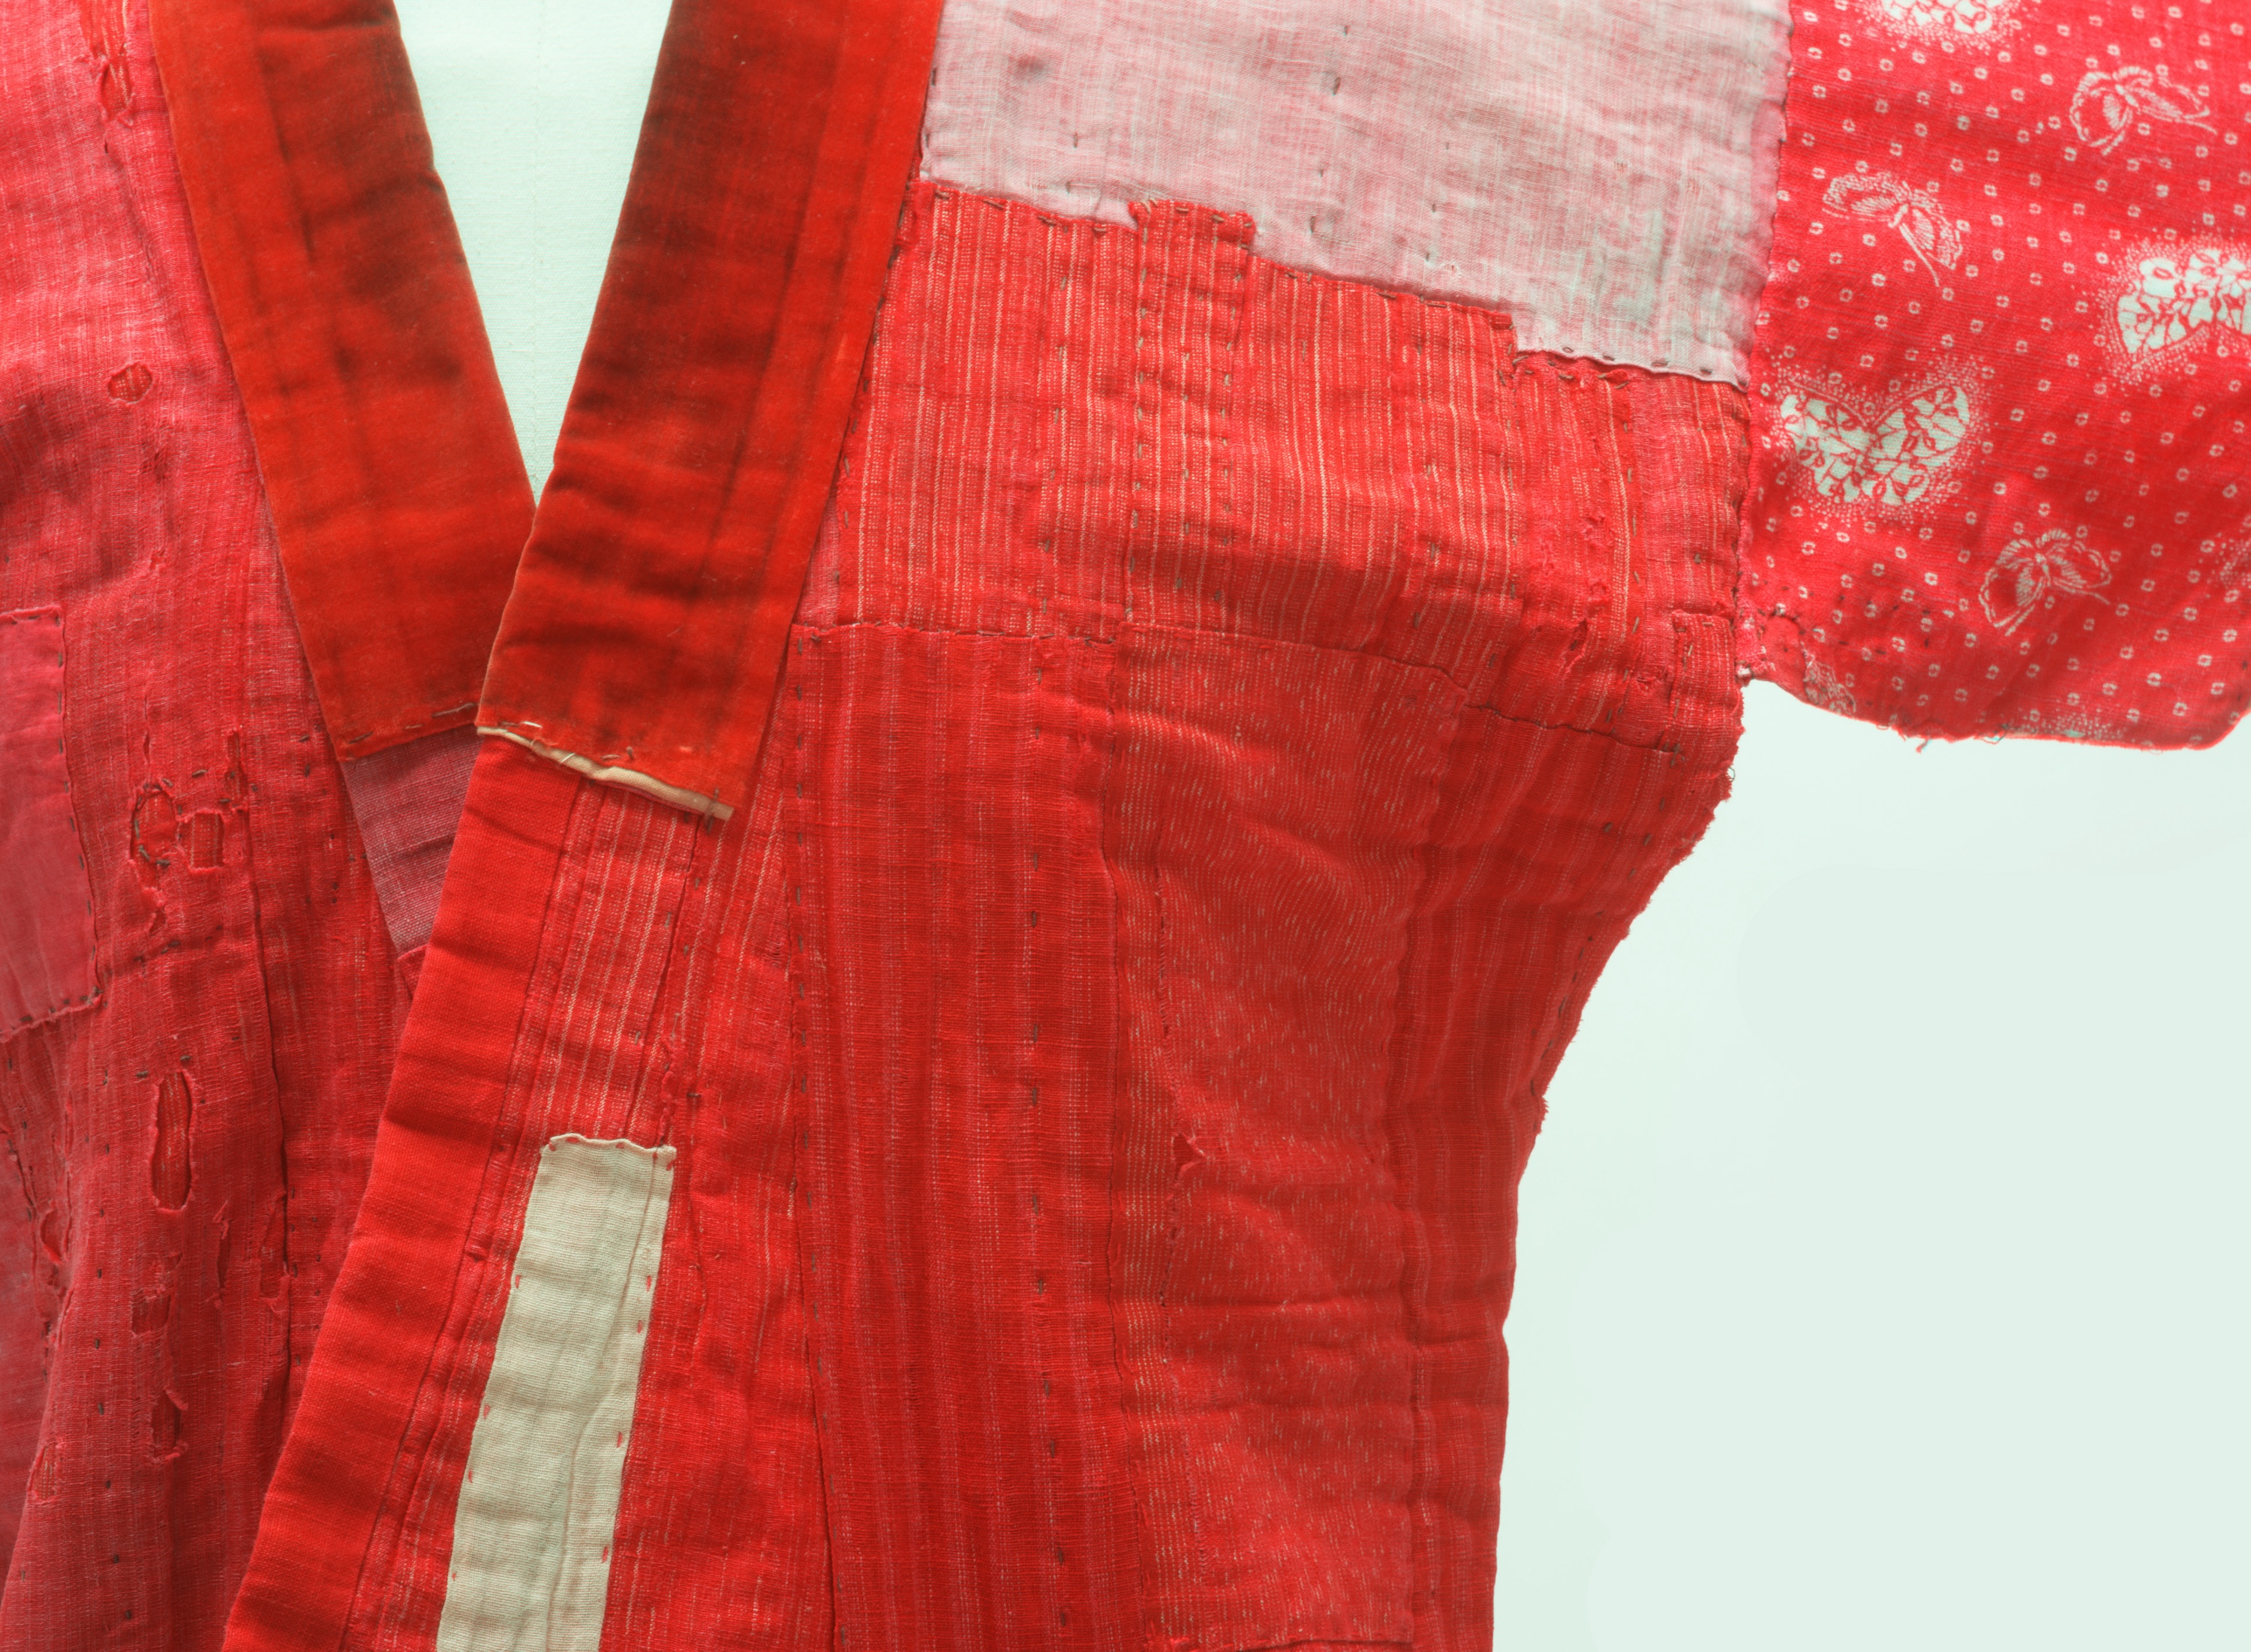
An especially striking garment in the Mingei’s collection is a coat believed to be from the Dong culture in Guizhou Province, China. It has a dark-blue background and dragon motifs embroidered with golden thread (Figure 1).
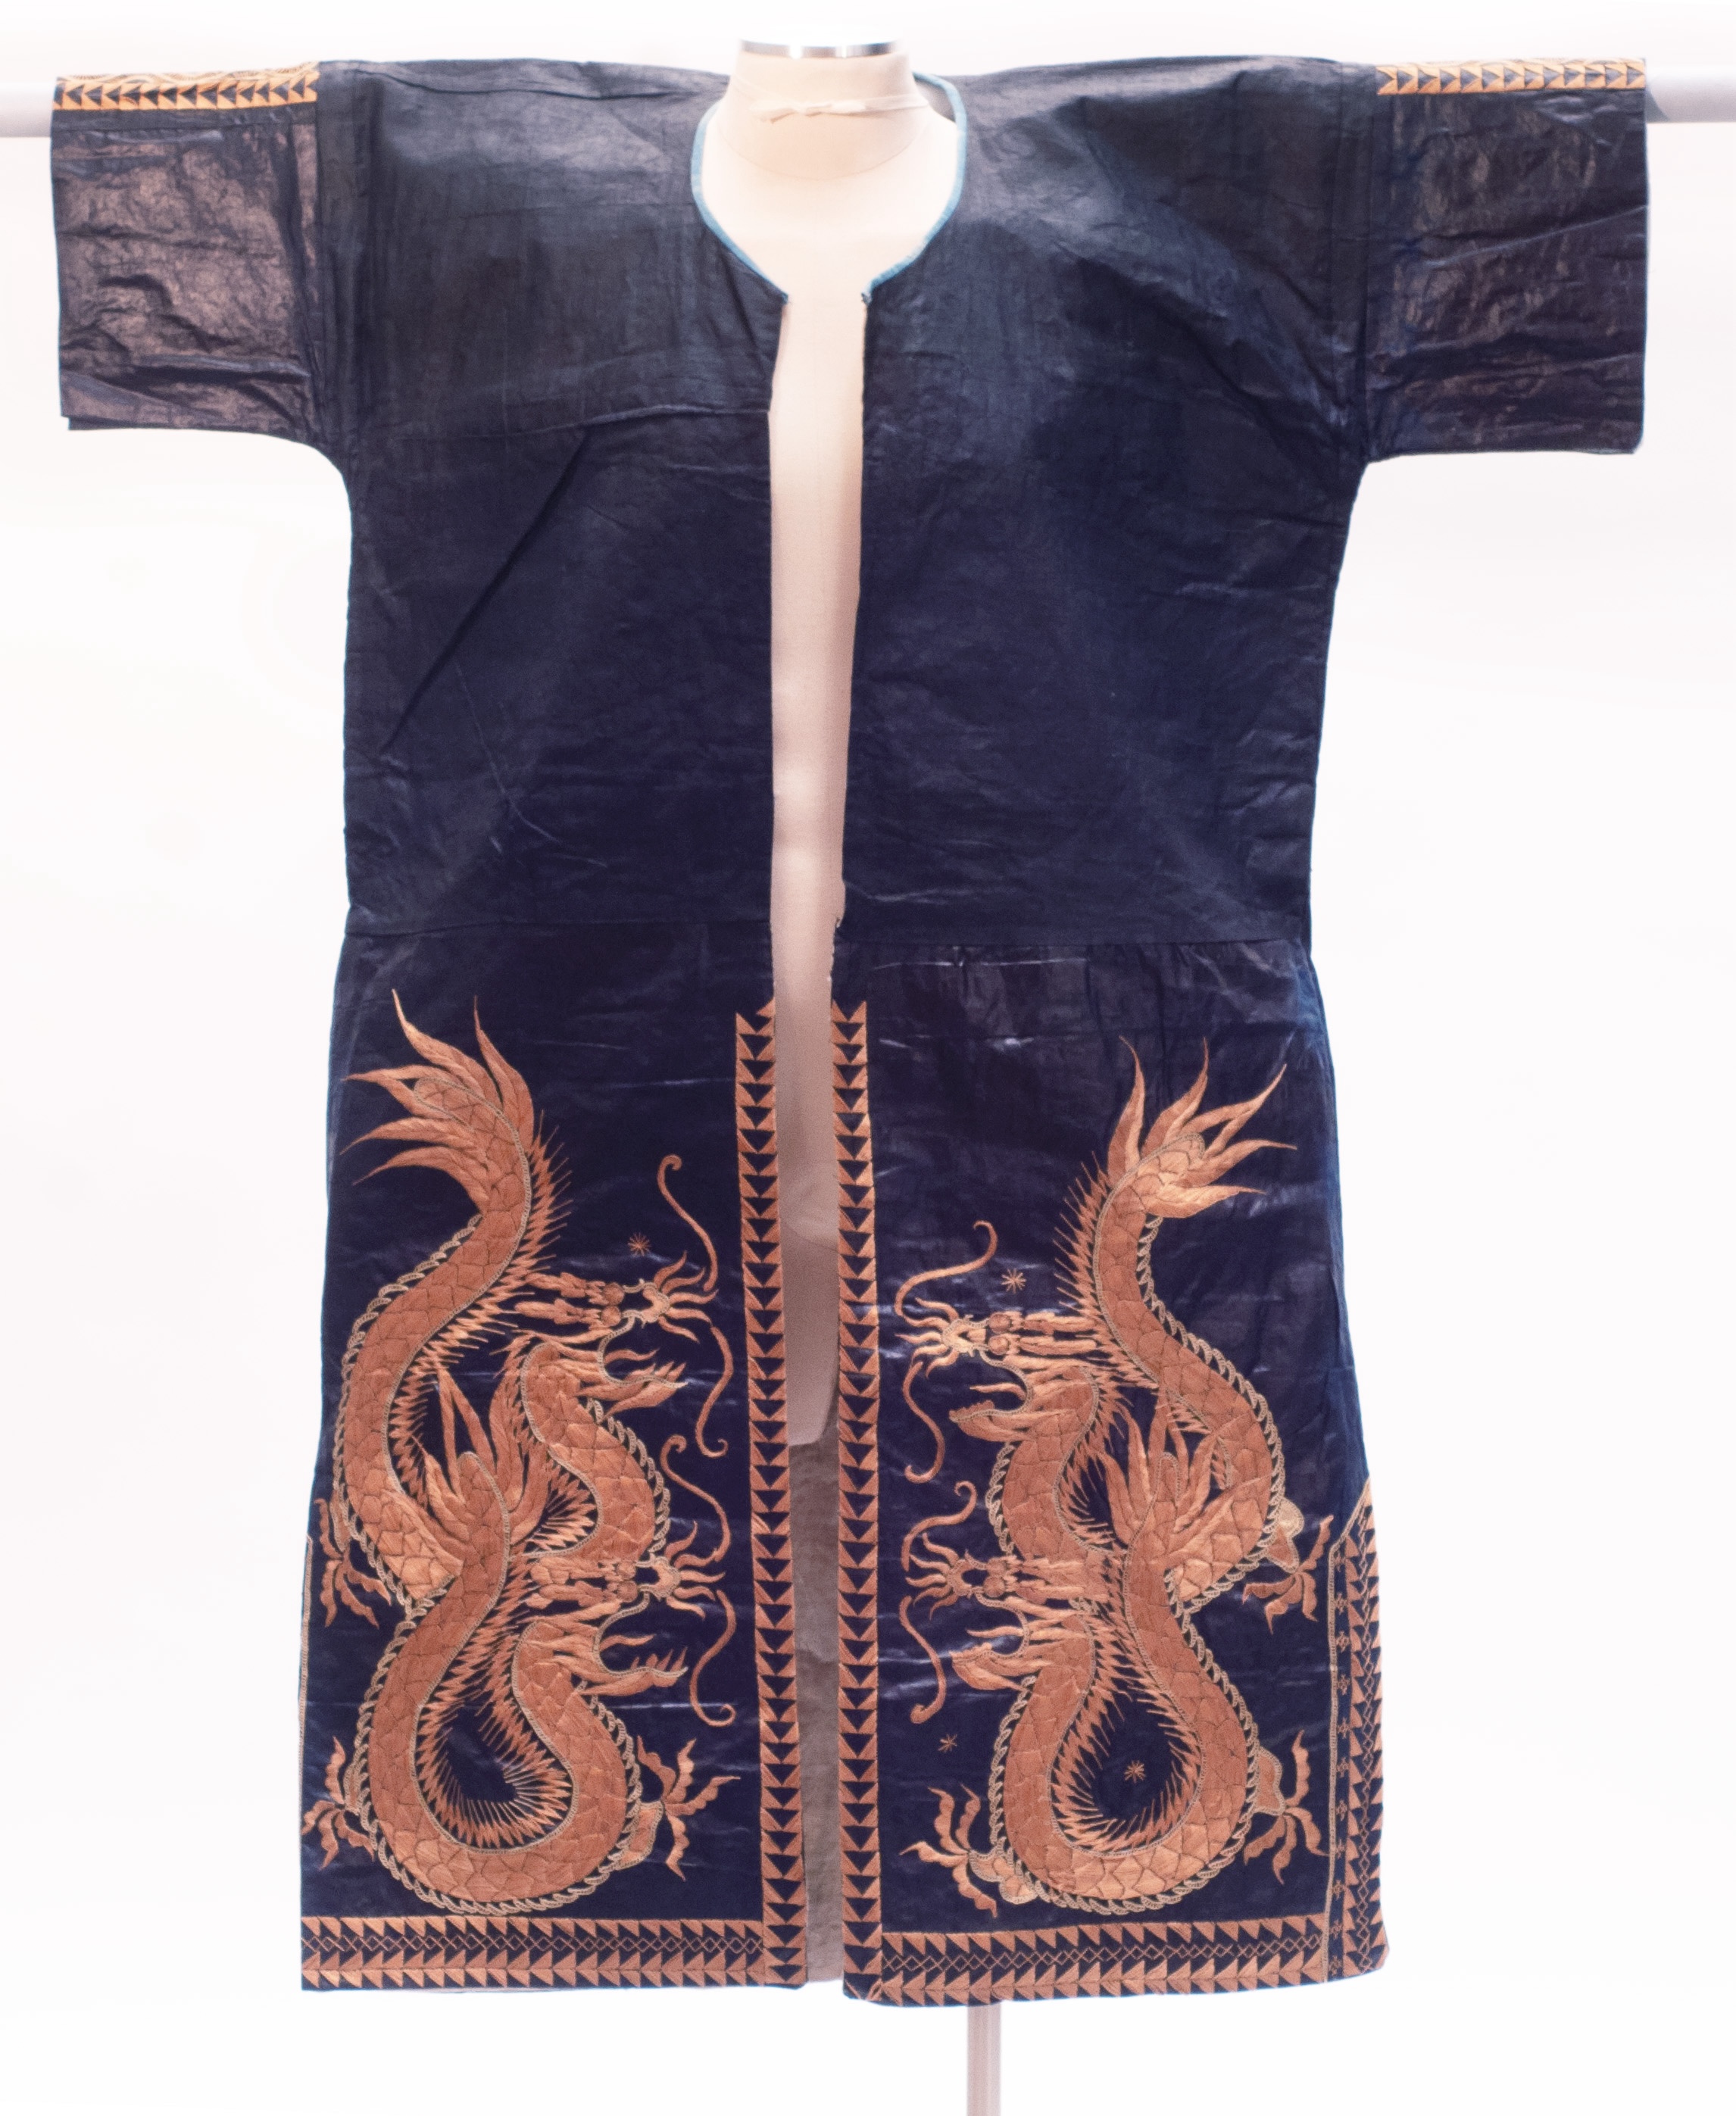
In preparation for the Blue Gold exhibition, several textiles from the collection, including this coat, were investigated with noninvasive scientific methods, in order to protect their physical integrity. The technical investigation of the coat revealed some unexpected features, which are explored in this essay.
An important question in the study of each object is: Is this made with indigo? Experts often distinguish indigo from other blues by noting the object’s cultural and geographical context and carefully observing its hue with a trained eye. Perception of color is tied to how a material absorbs and reflects light in the visible region of the electromagnetic spectrum. This region covers a wavelength range of 400 to 700 nanometers (nm). The color-imparting molecule of indigo dye—called indigotin—absorbs certain wavelengths and reflects others, resulting in its characteristic navy hue.1 In high concentrations, indigo absorbs most visible light, reflecting only a small amount of blue light, which humans perceive as dark blue.
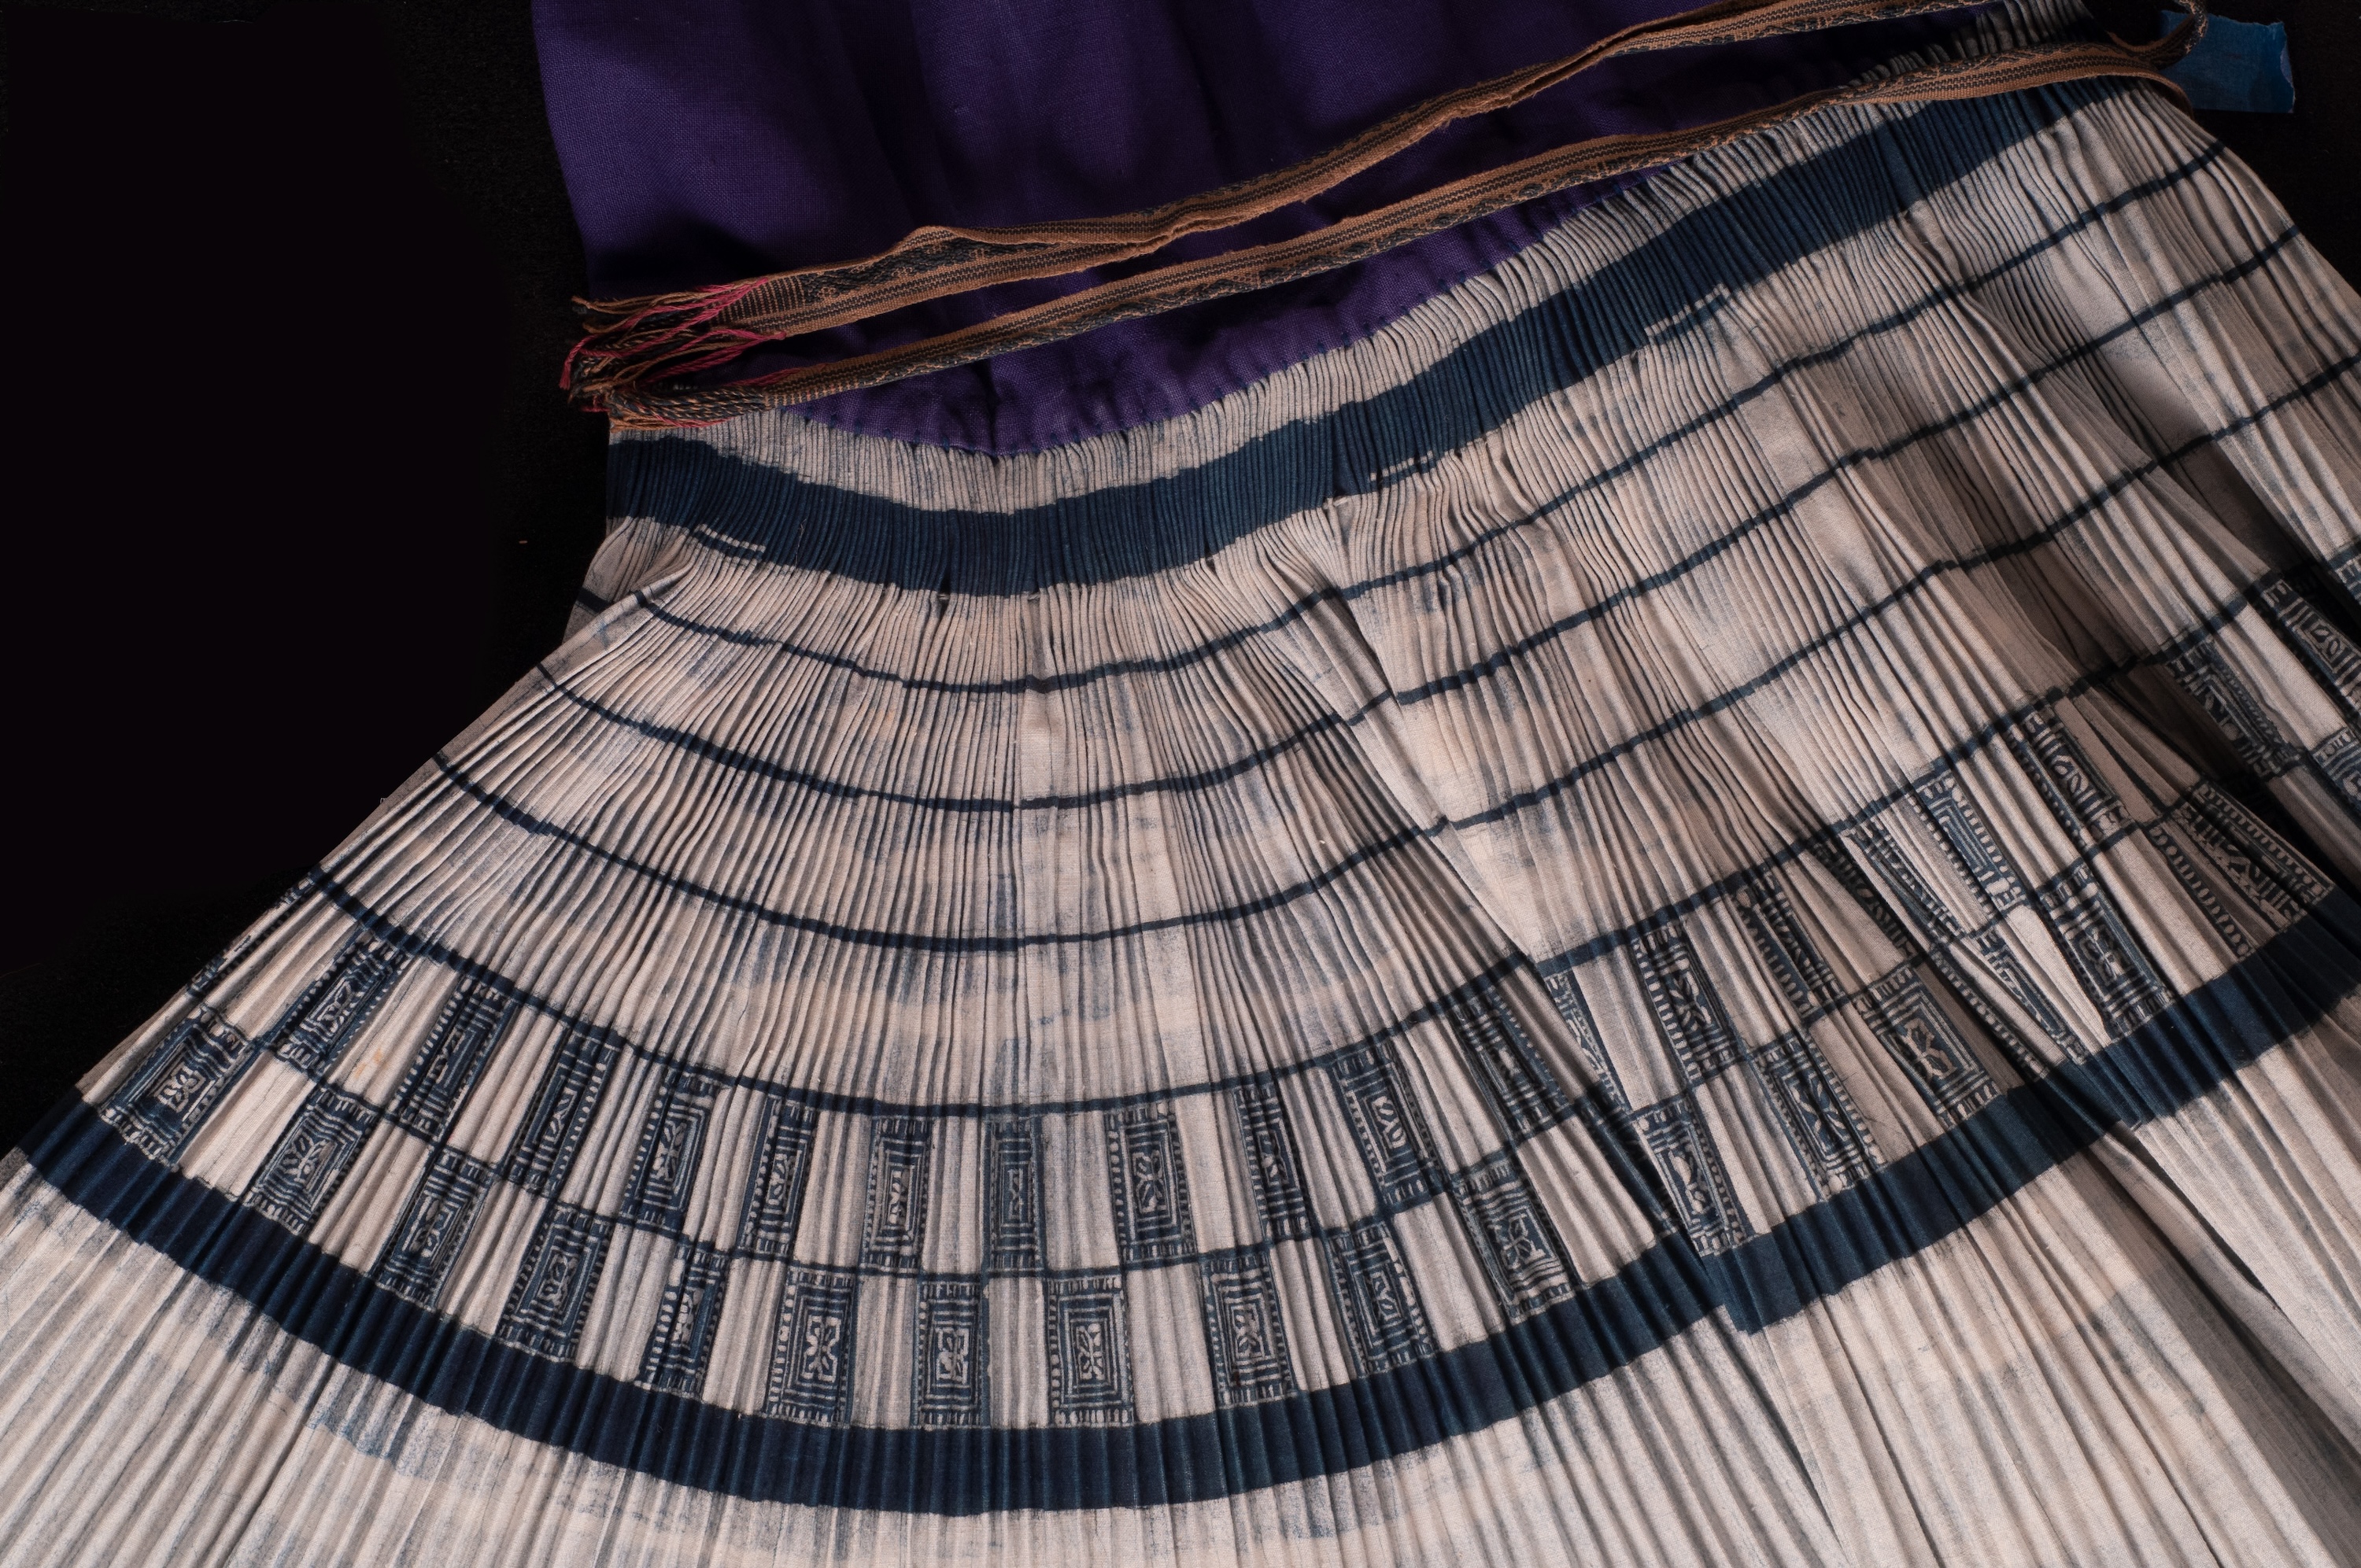
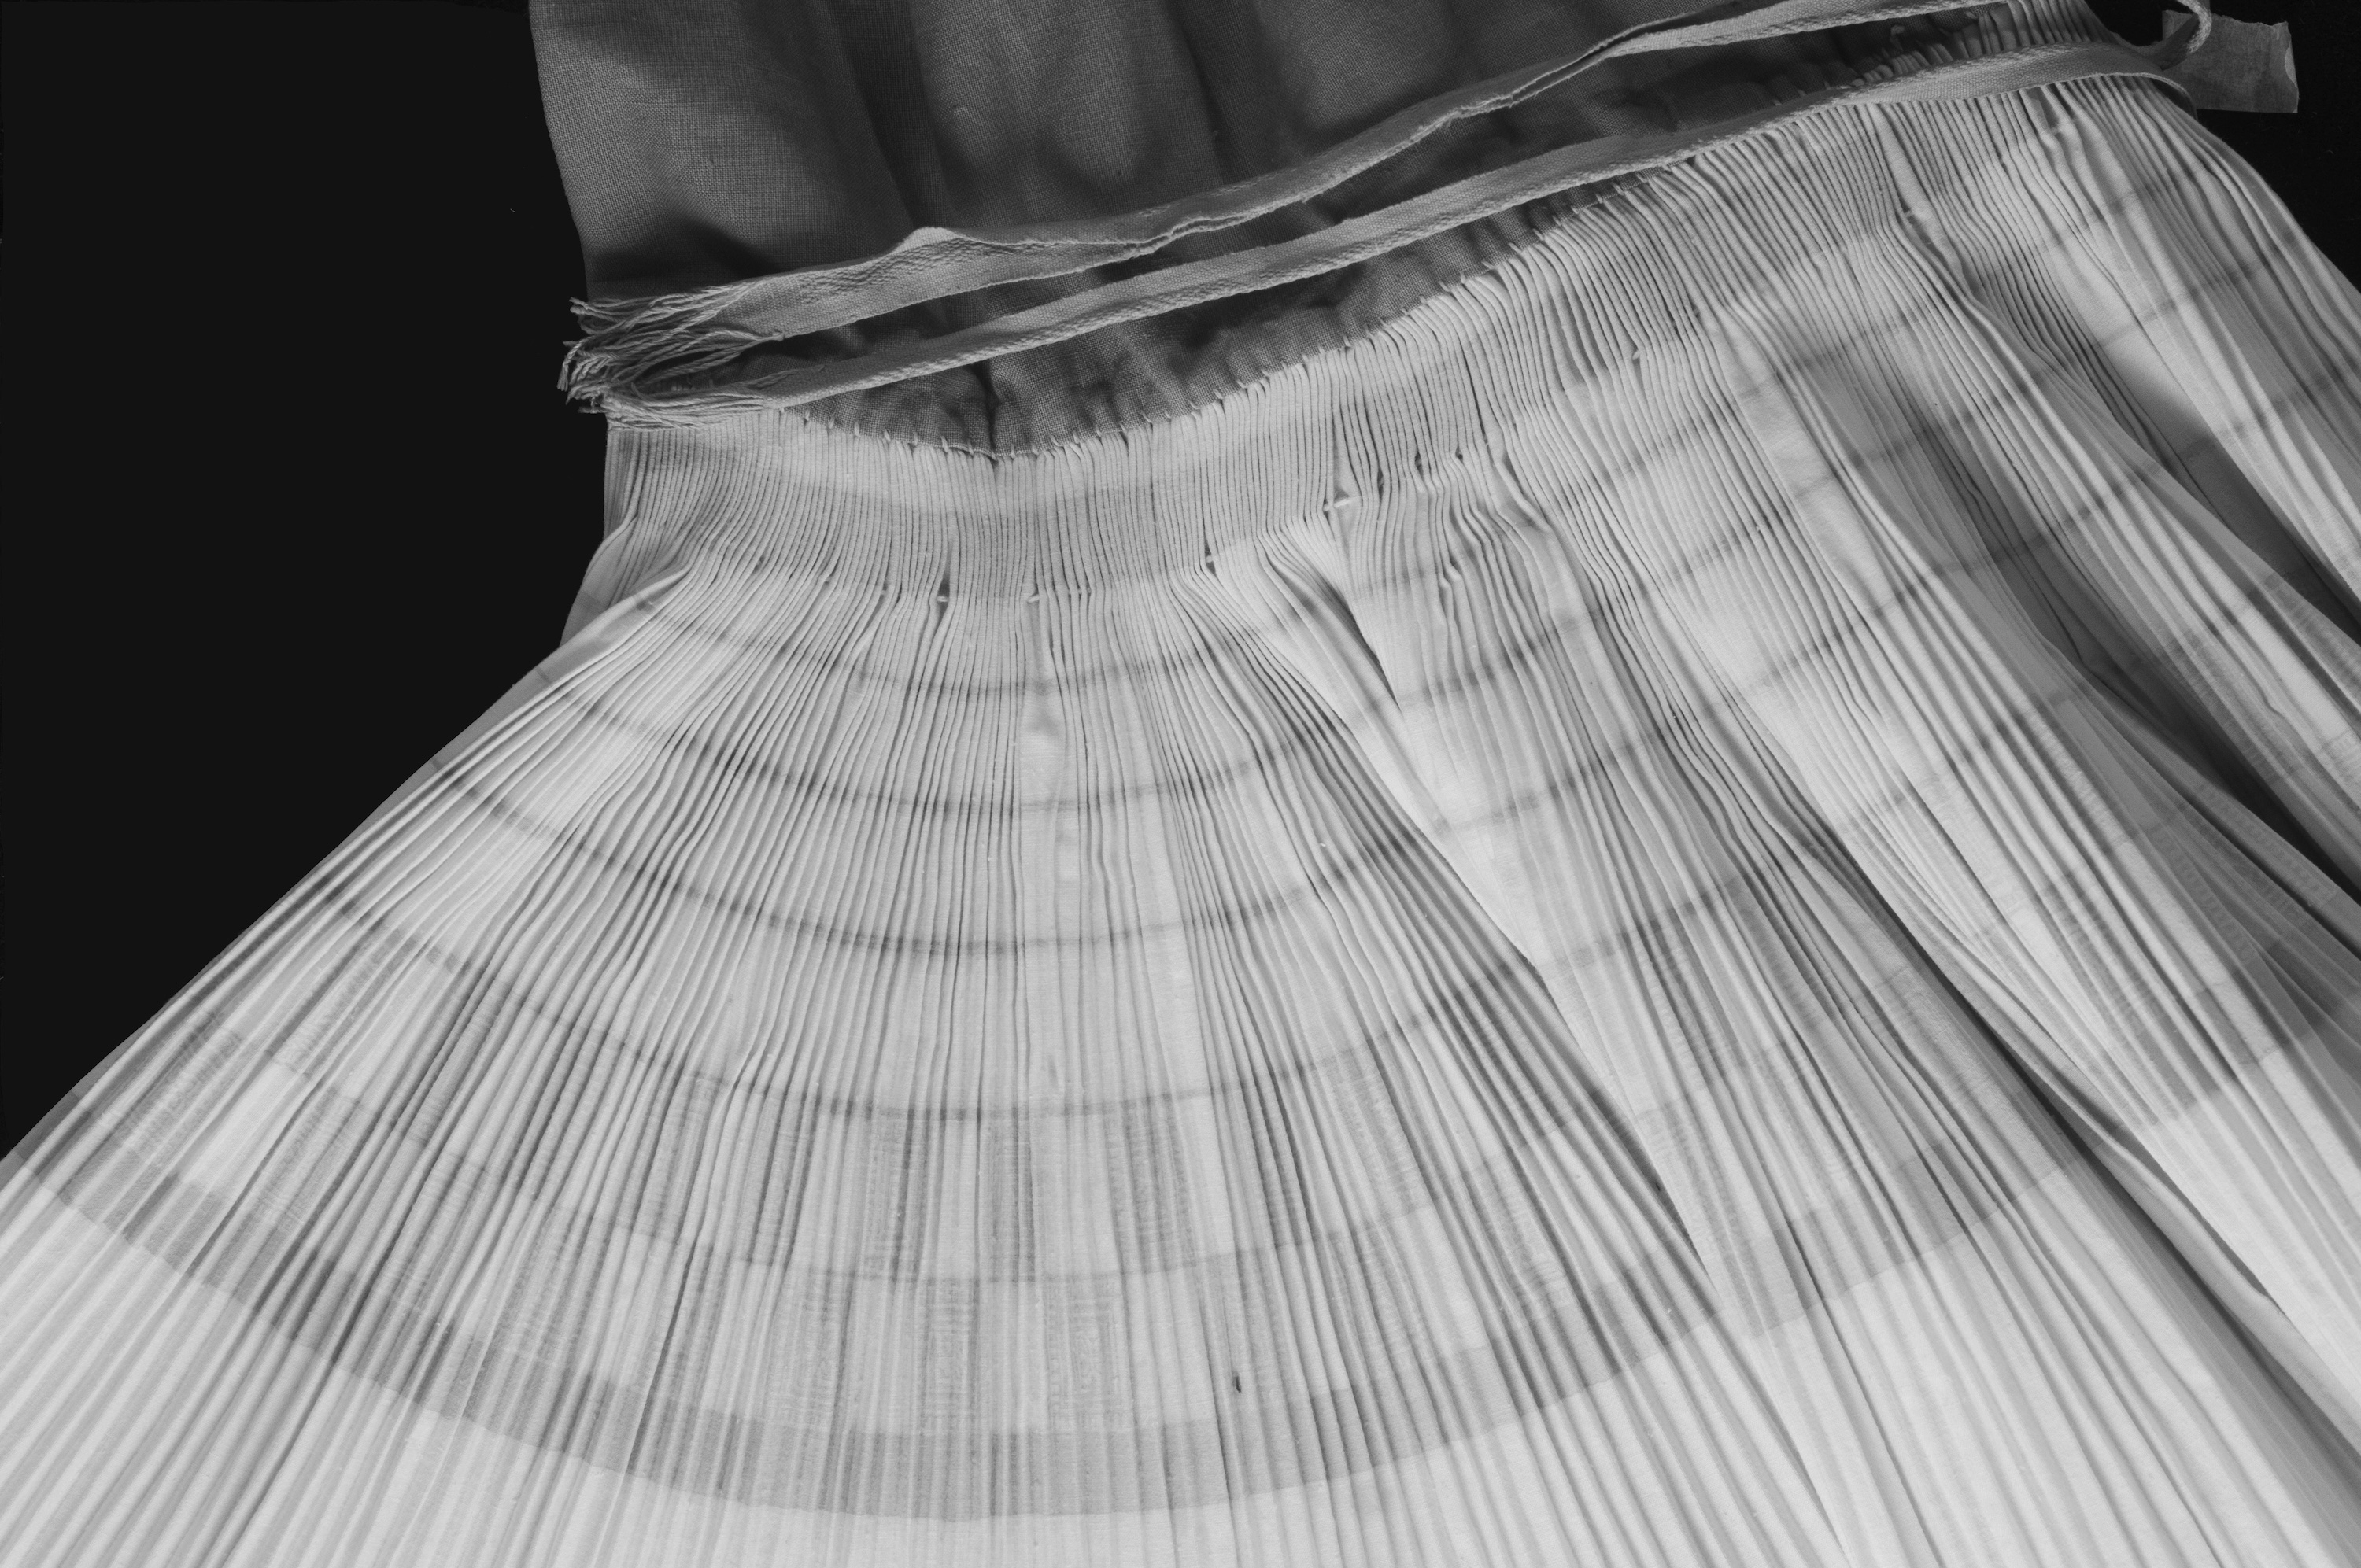
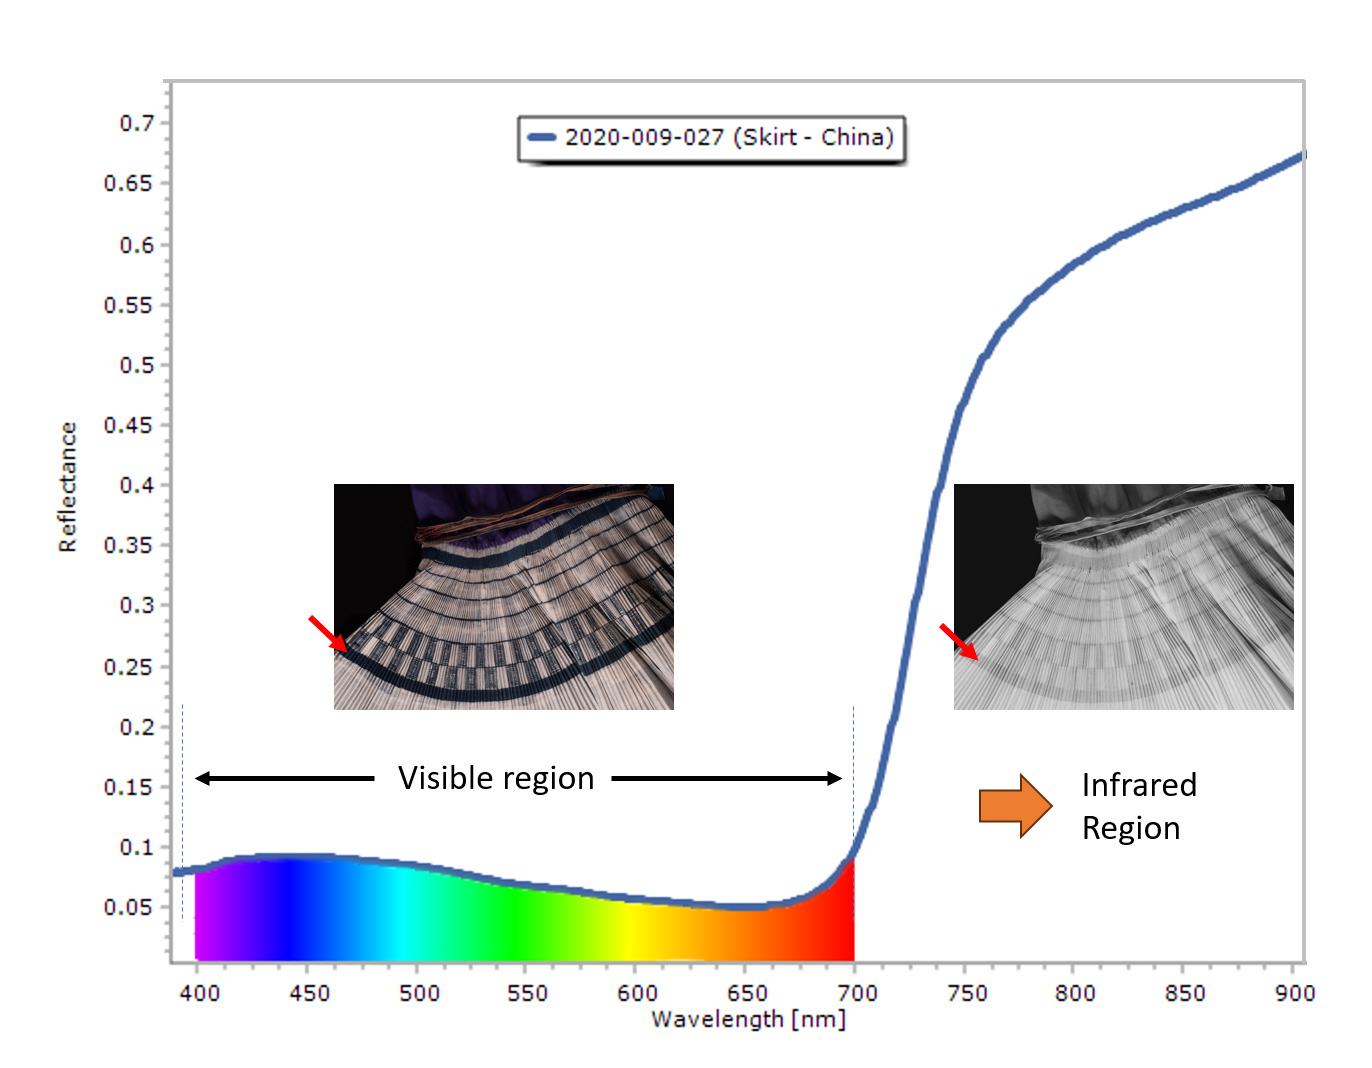
We know that indigo is present in a twentieth-century pleated cotton skirt from China, also in the Mingei’s collection (Figure 2). Its dark-blue stripes and square floral pattern contrast beautifully against the white fabric. The blue of the skirt is similar to that of the coat with dragon motifs. Given the cultural context of the coat, one might be inclined to say that it was likewise dyed with indigo.
To verify this assessment, the author used infrared imaging, which exploits the knowledge of how indigo interacts with light. Beyond the visible range of the spectrum, at the onset of the infrared region just above 700 nm, indigo behaves distinctively—strongly reflecting infrared radiation.2
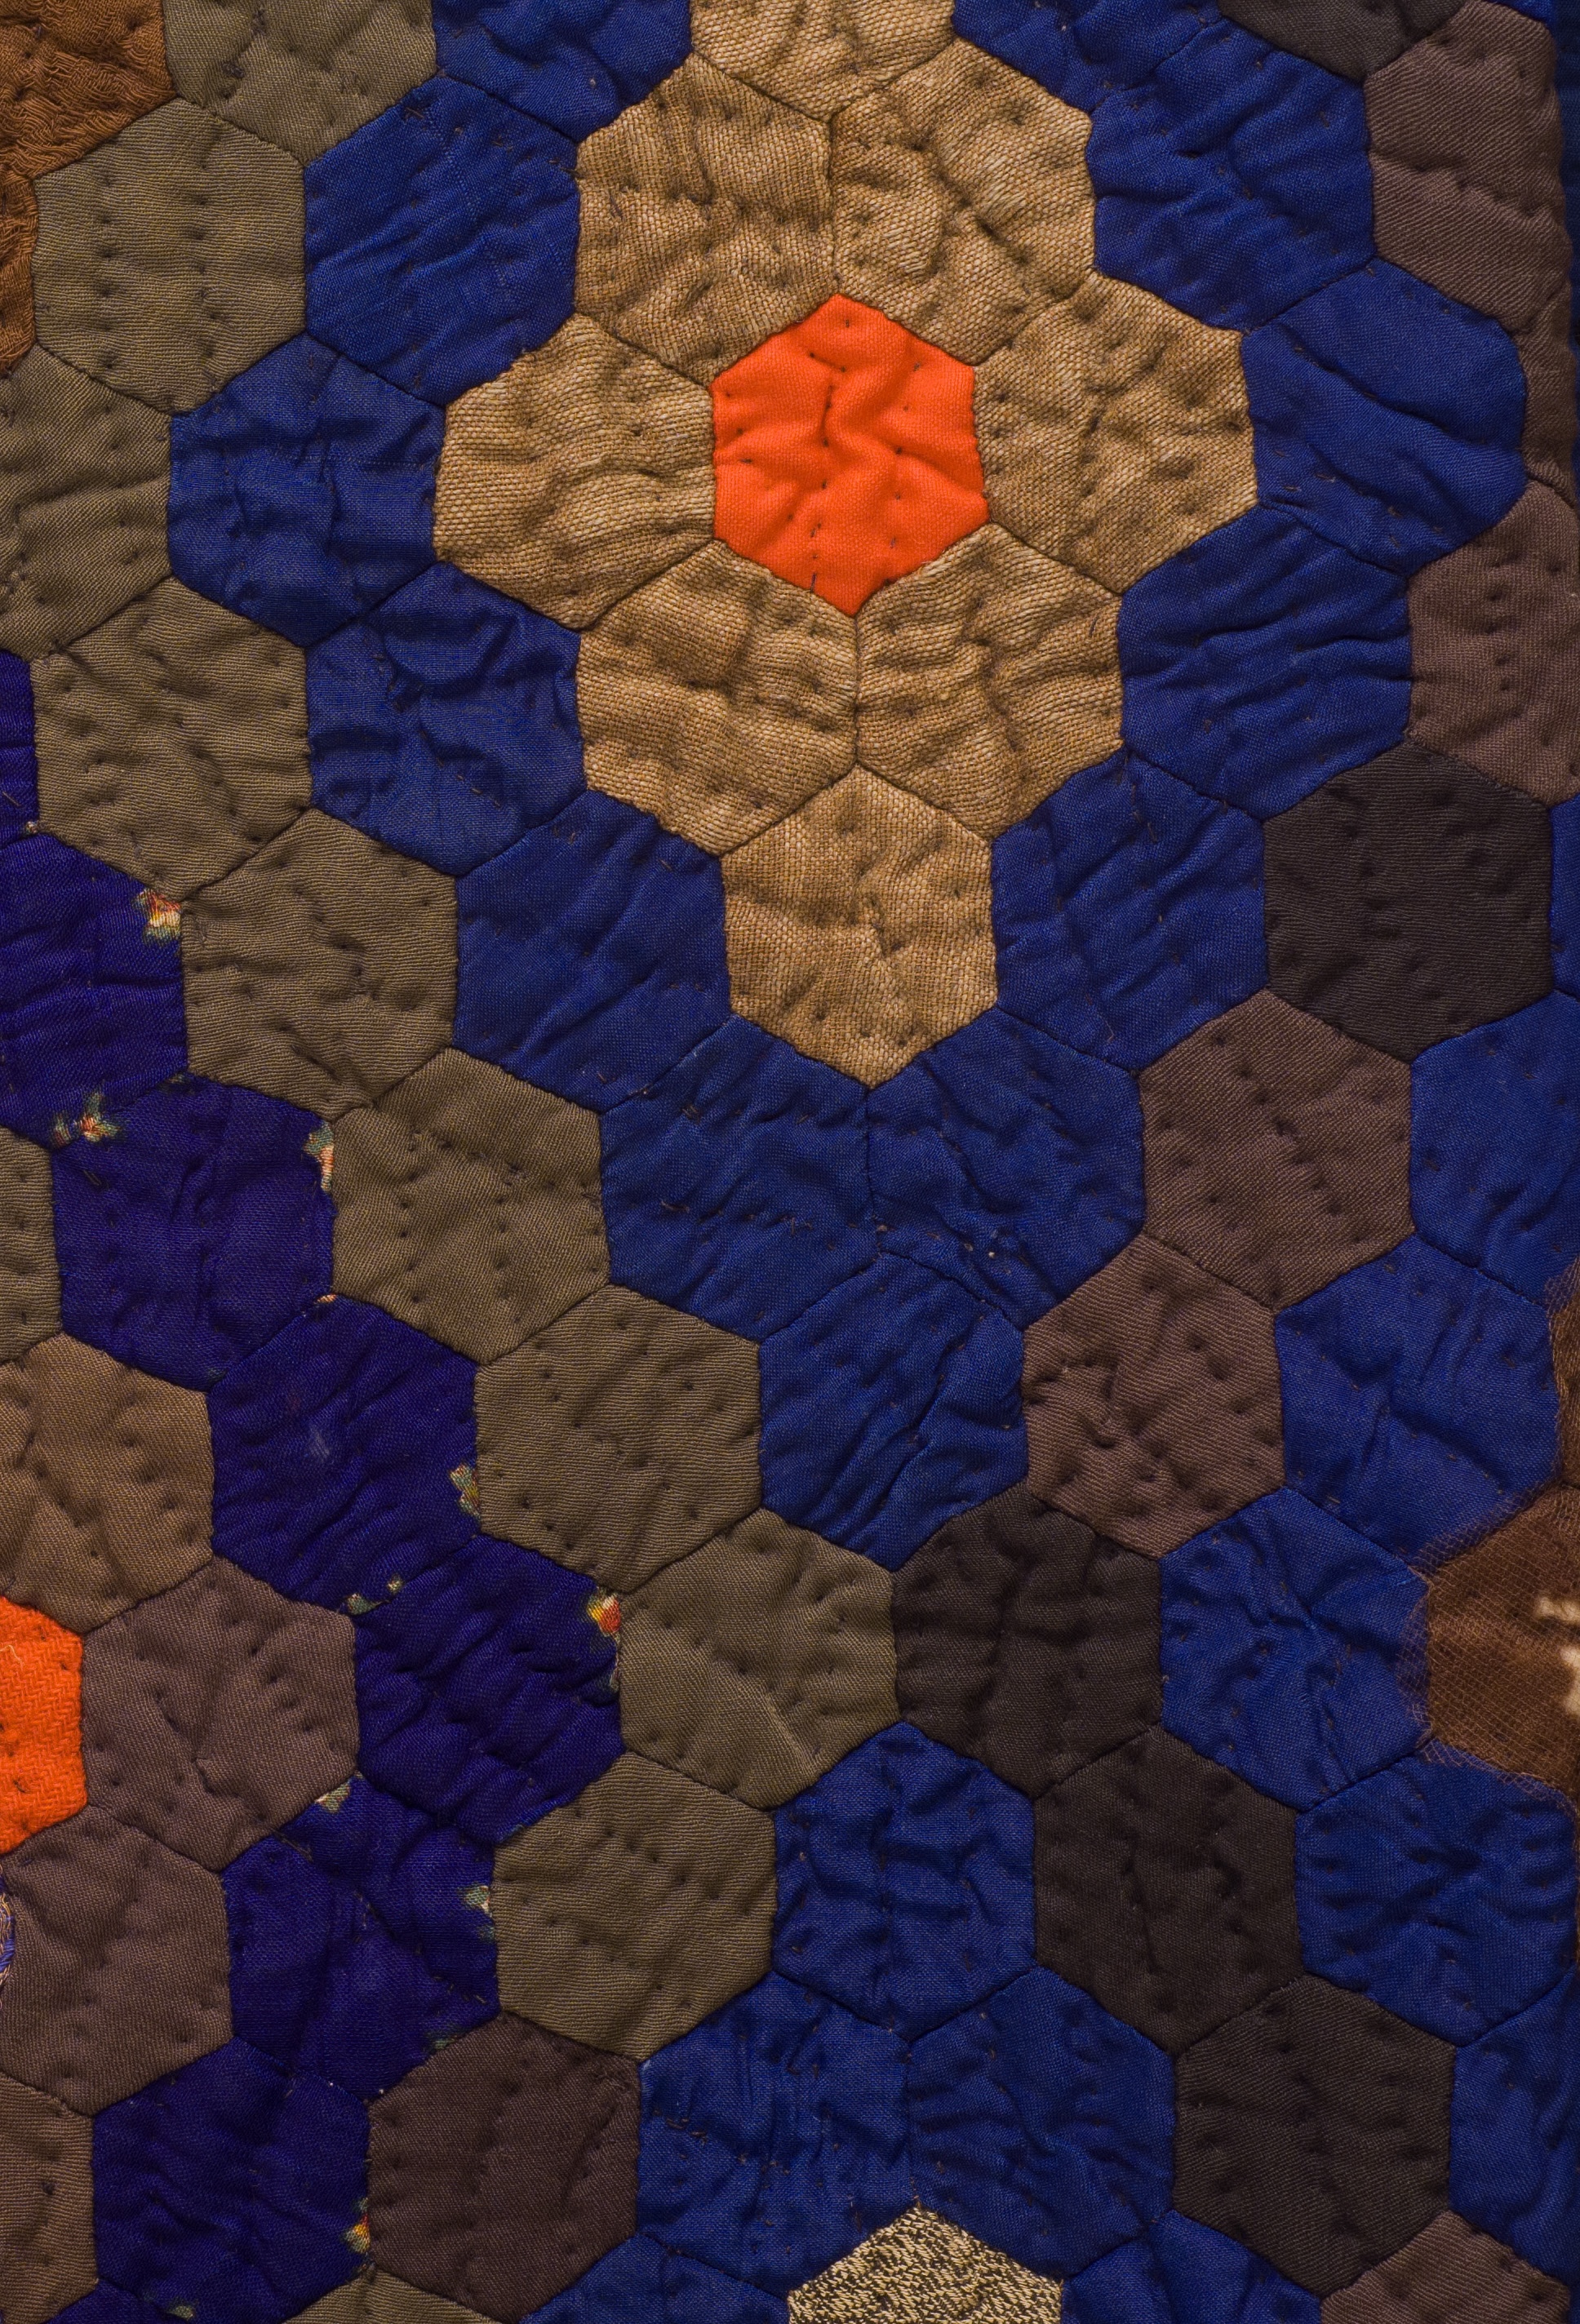
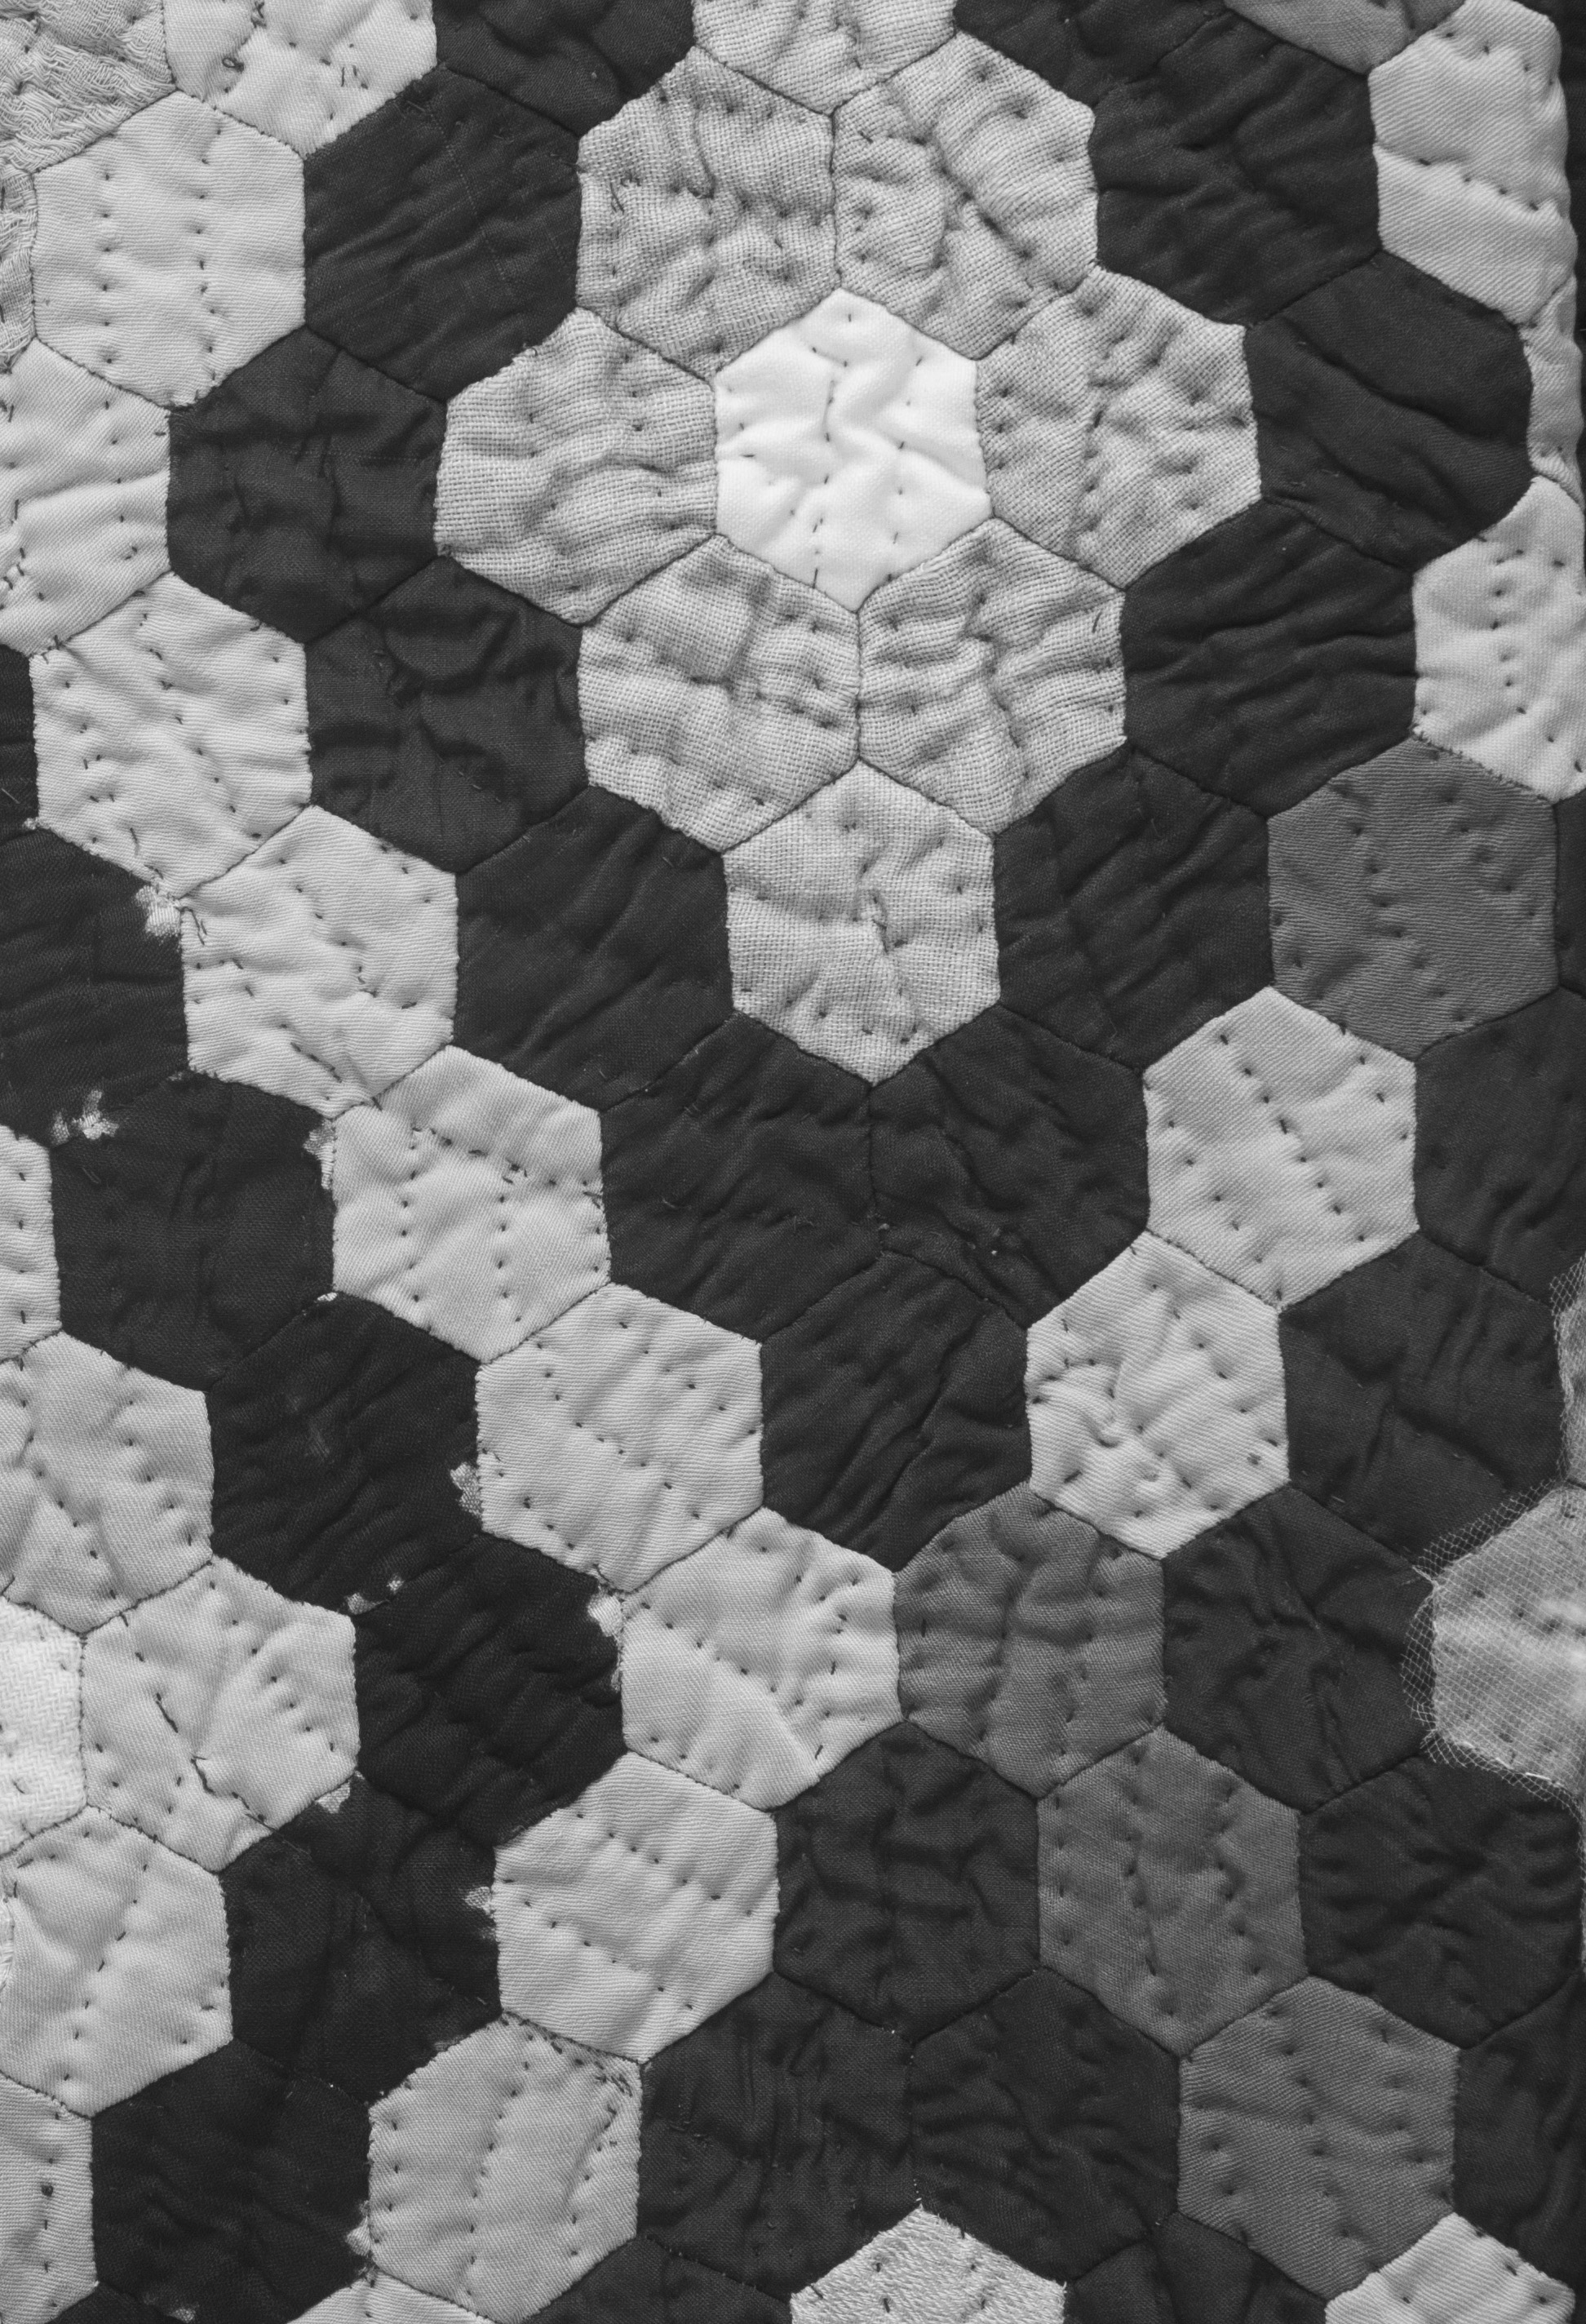
While human eyes cannot detect infrared radiation, certain cameras can. Infrared images are monochrome, as color is perceived only in the visible region. Darker regions correspond to higher absorption of infrared radiation, while brighter regions correspond to higher reflectance of the same.3 For example, in the infrared image of the skirt from China (Figure 3), the regions with indigo appear light gray, which contrasts less with the white fabric than the same regions in the conventional photograph. With this technique, it is easy to determine when a blue is not indigo. It will appear dark in the corresponding infrared image, like the blue hexagons in the quilt reproduced here (Figure 4.1–2).
Based on this, one might expect the dark-blue fabric of the coat with dragon motifs to appear light gray in the infrared image. Remarkably, whereas the sleeves and skirt appear bright in the infrared image, the upper torso remains dark; it absorbs infrared radiation and thus cannot be indigo (Figure 5). Why was a different dye used for this portion, and why was the fabric made to look indistinguishable from the rest of the coat?
The Mingei also has a shiny dark-blue vest with similar embroidered dragon motifs that was designed to complement the coat. When the vest and coat are imaged together, the entire ensemble is bright in the infrared image, except for gaps between the vest and the shoulders of the coat (Figure 6.1–2). Apparently, the indigo-dyed cloth was only for the visible parts of the ensemble. Was this for economic reasons? Could the scarcity or high cost of indigo have led to the substitution of a cheaper, more readily available dye for the inconspicuous fabric?
Why did the maker use indigo at all, when a more accessible dye yielded a similar result? Close observation of the upper torso fabric shows that it is not as shiny as the rest of the garment. The shininess in the rest of the coat comes from beetling, or pounding with mallets, a common practice in the Dong culture.4 In combination with dyeing the textile five to seven times, the beetling process packs the dye tightly within the textile, resulting in a high concentration of dye particles. This imparts a deep blue color, along with a copper-like luster. It is possible that the substitute dye did not respond well to beetling. The decisions made in the construction of the garment point to the perceived value of this coppery sheen for the culture of origin.
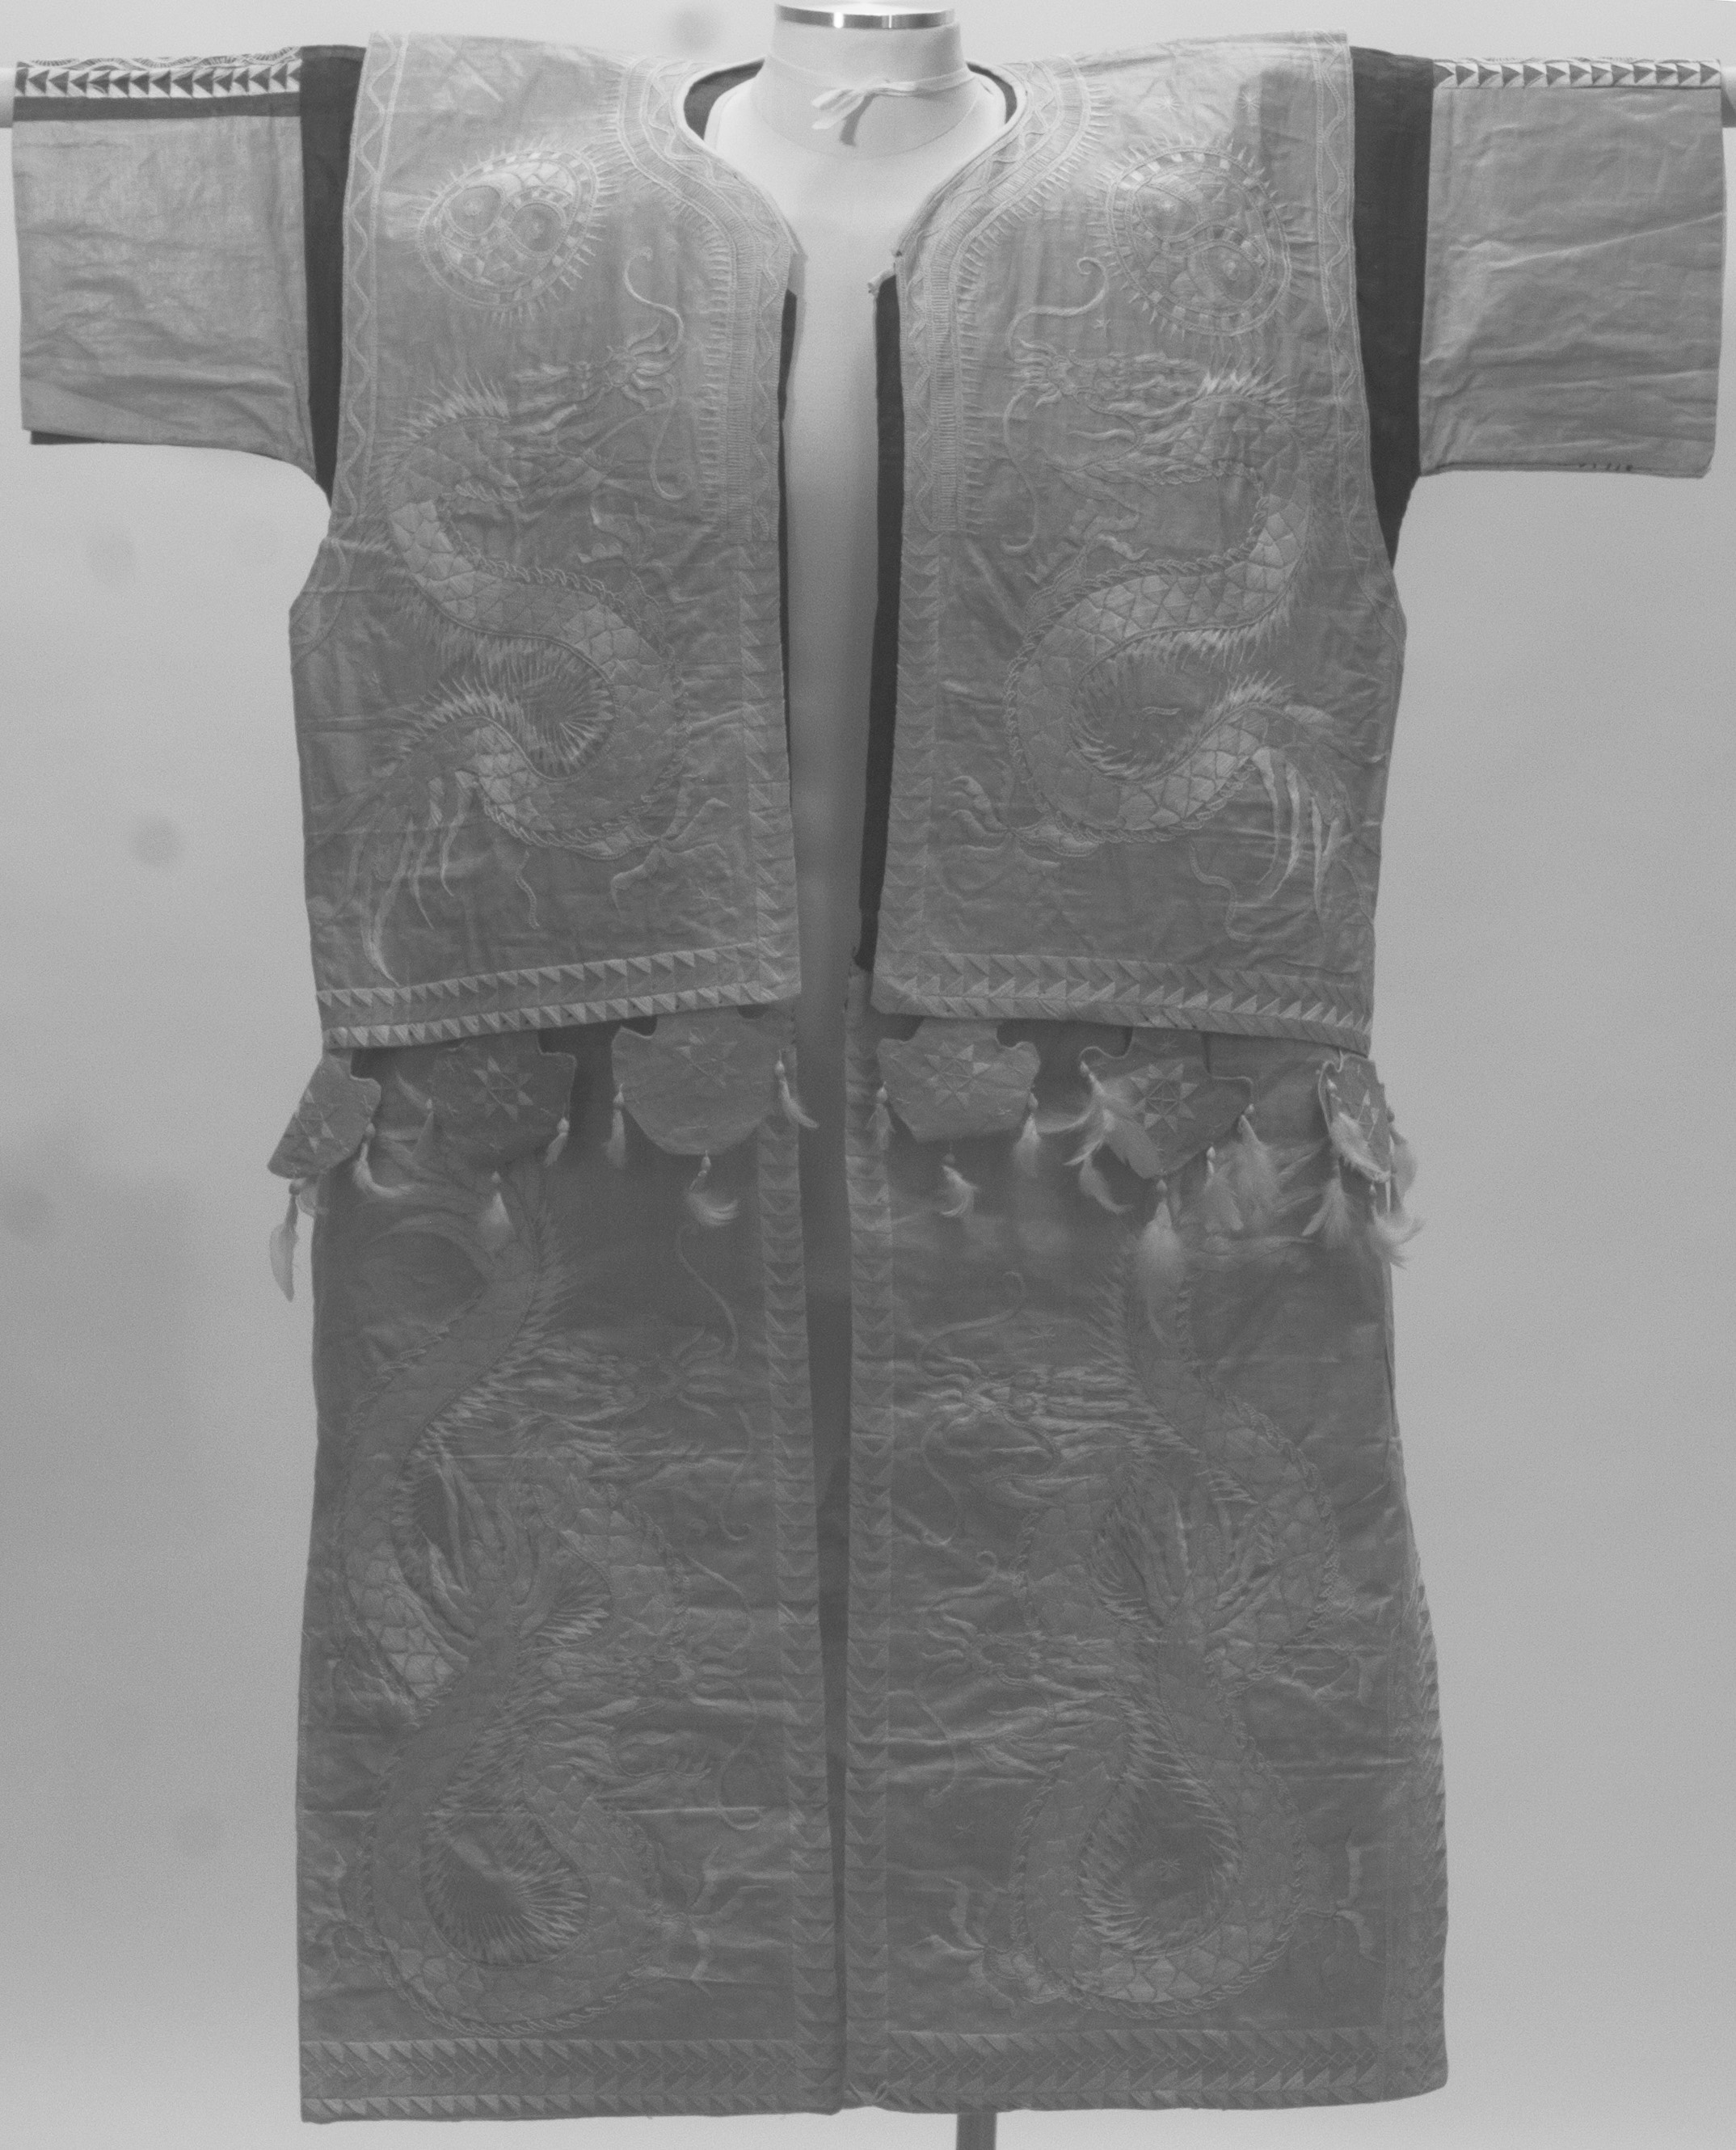
Such infrared imaging can inform research about the cultural context and history of an object containing indigo. However, it can prove cumbersome to look at infrared images of polychrome textiles to check which regions correspond to blue regions in a conventional photograph, especially if the other colors also reflect infrared radiation. This is the case with the golden embroidered dragons in the coat. To picture the indigo-dyed regions more clearly, scientists also produce infrared false color (IRFC) images.
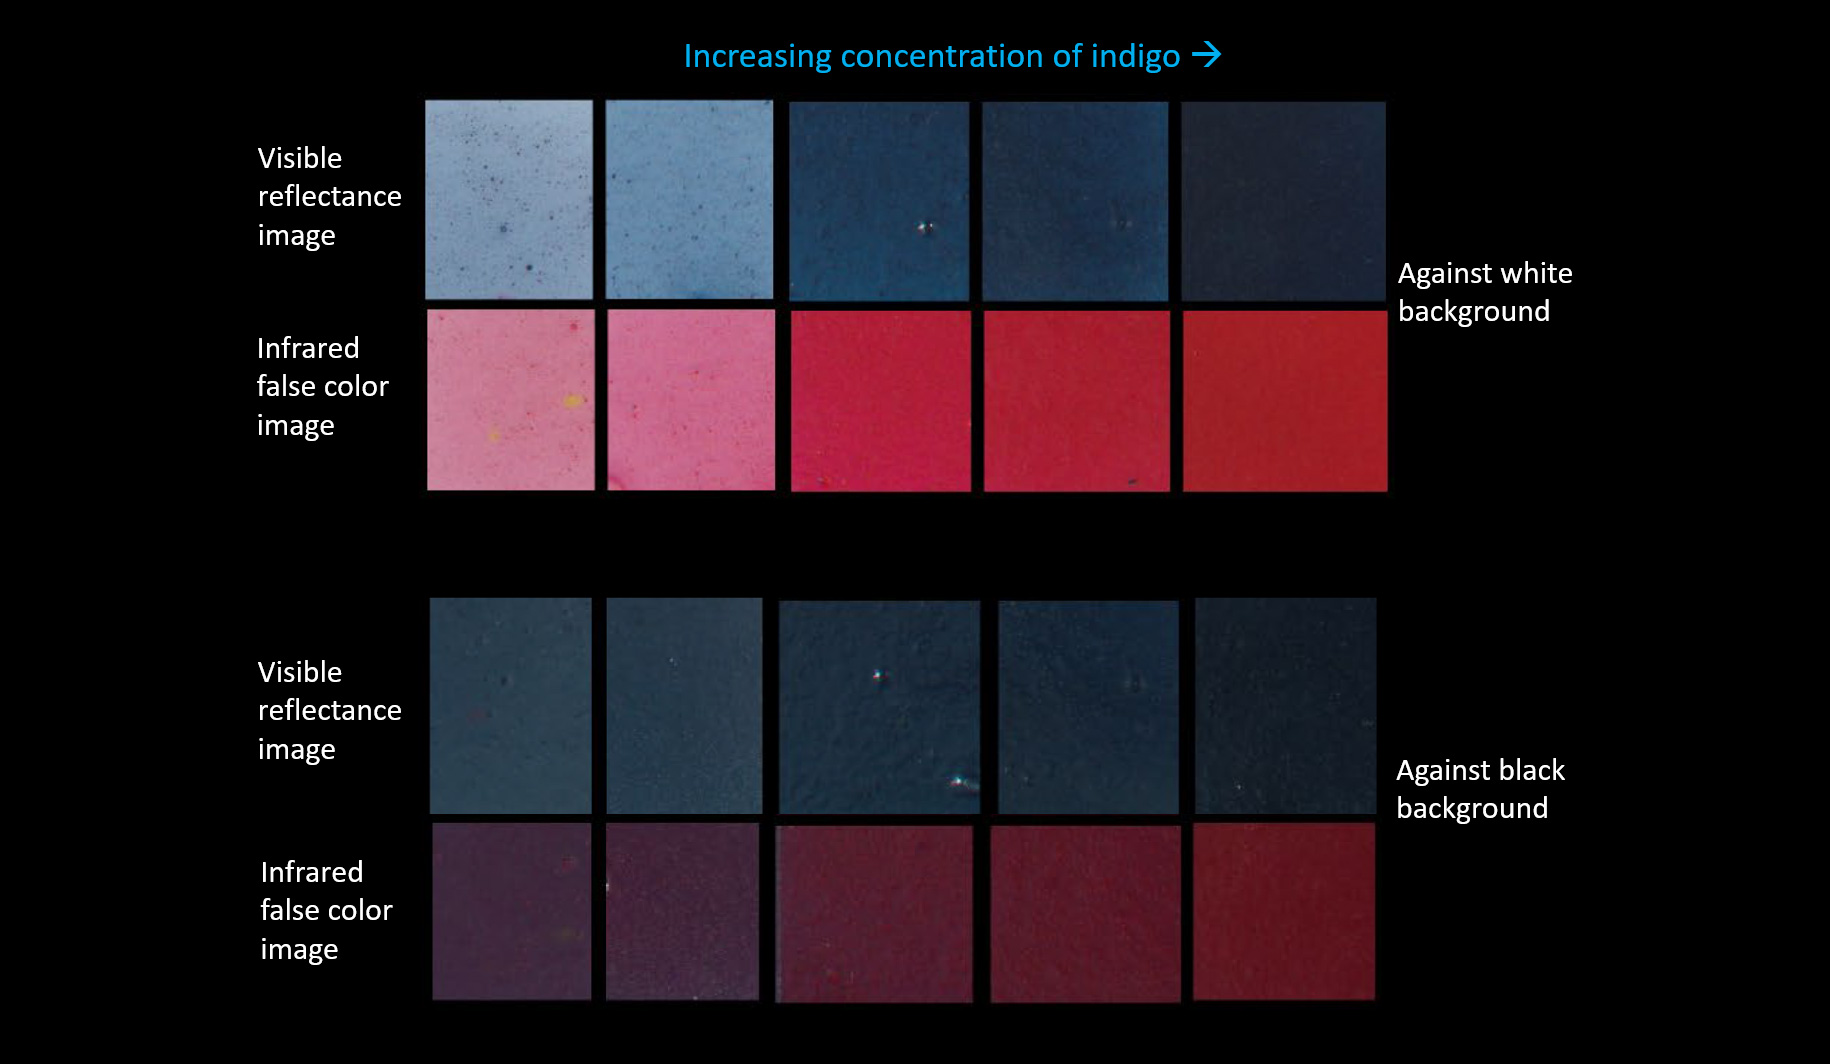
This type of postprocessing is useful for identifying or mapping regions containing indigo in textiles and other materials, especially those from before the eighteenth century, when modern blue dyes were invented.6 For example, a Peruvian textile fragment (Figure 8.1–3) has blue regions—such as the collar of the figure depicted on it—that are bright pink in the IRFC image, which is characteristic of indigo. In this case, identification of indigo dye is supported by the fact that indigo could have been one of the only blue dyes available at the time this textile was produced, between the eleventh and fifteenth centuries. The Peruvian fragment also provides insight into the different appearances of indigo based on the background color on which it was applied. Here, a darker red in the IRFC image corresponds to the blue-black background surrounding the depicted figure.
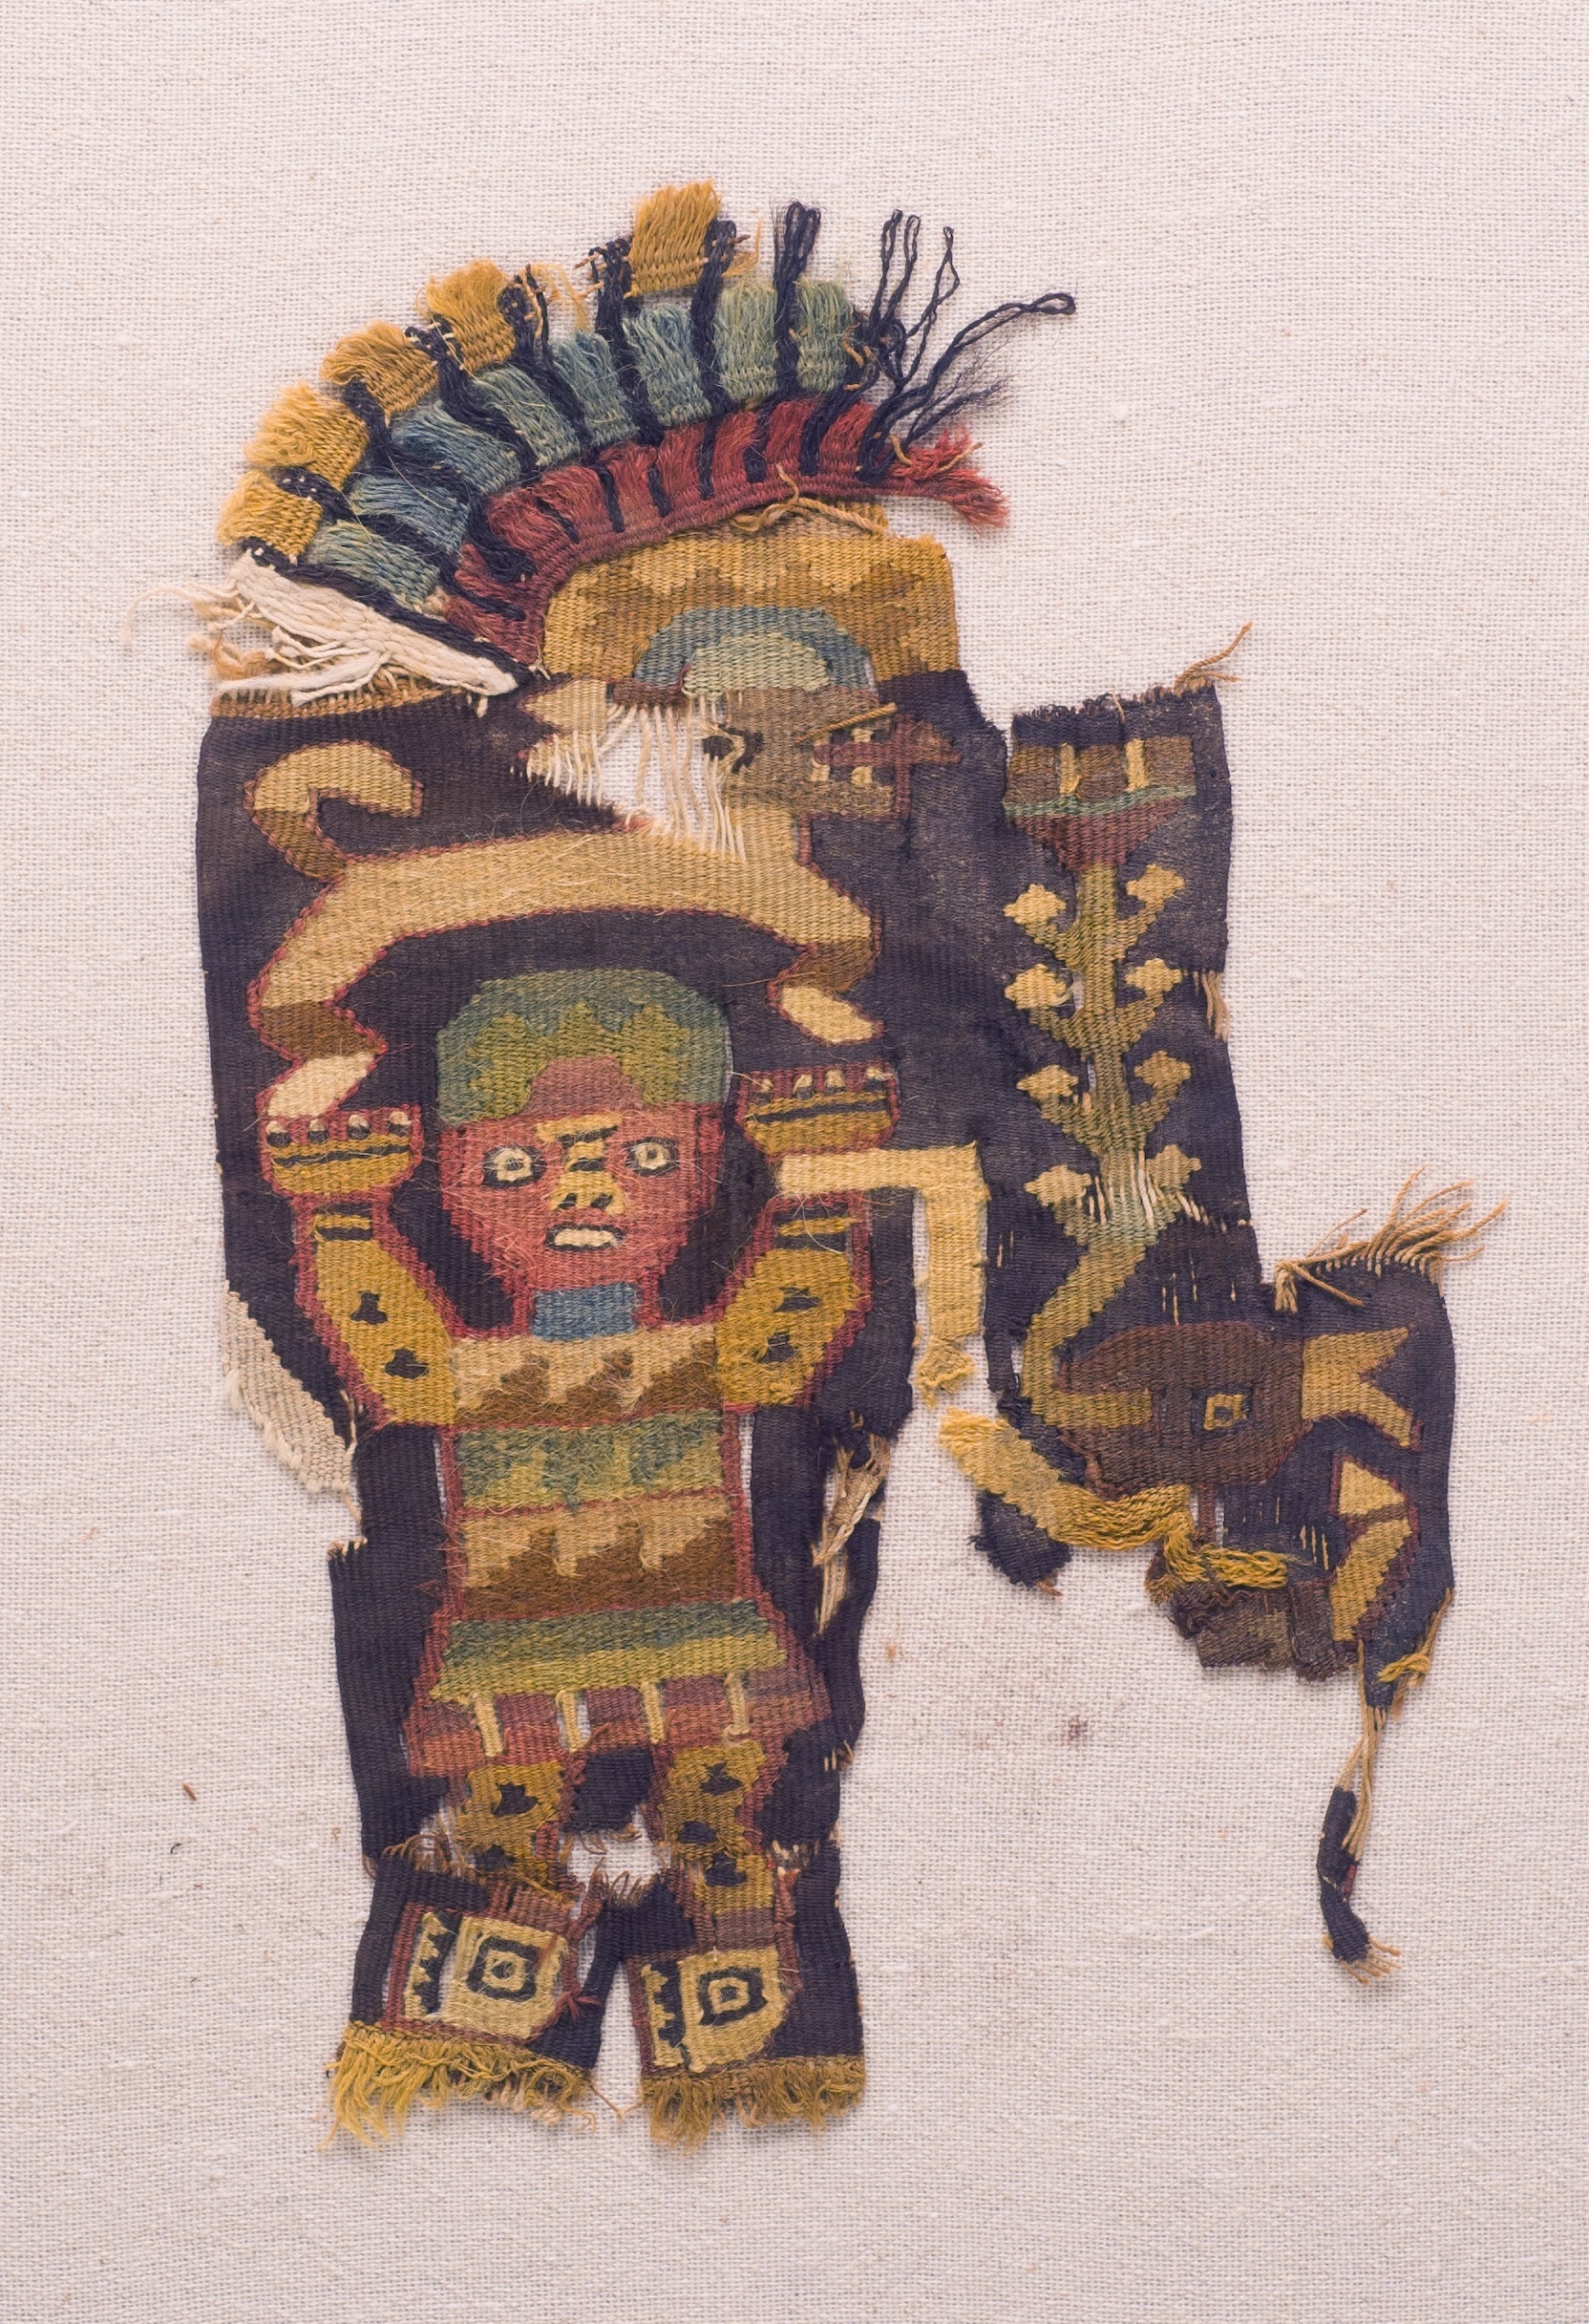
In fact, previous studies have shown that indigo applied in low concentrations on a black background can appear dark red in a corresponding IRFC image (Figure 9).7 This could indicate the presence of indigo in this blue-black background as well.
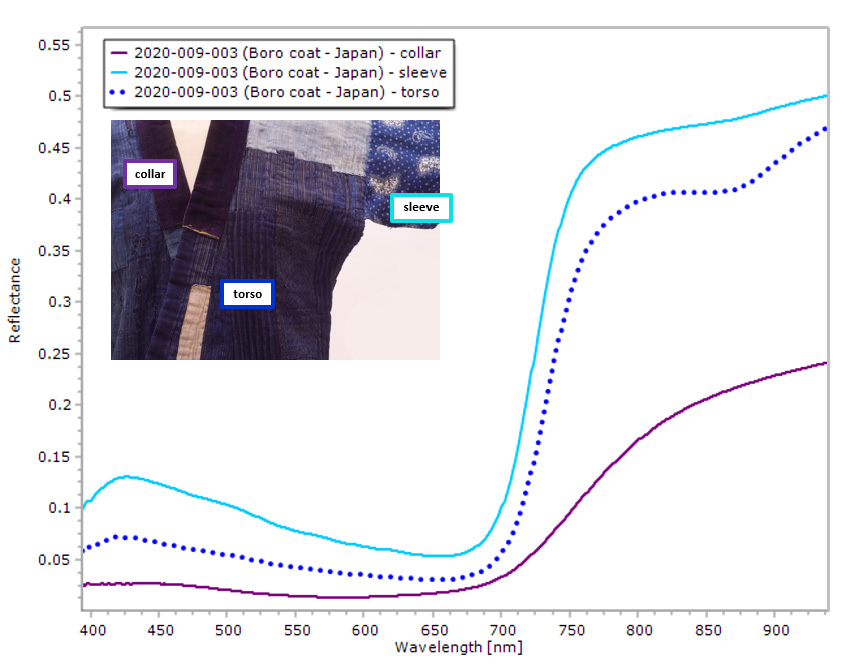
Modern synthetic blue dyes sometimes also reflect infrared radiation. Such dyes also appear reddish in IRFC images and can be difficult to distinguish based on imaging techniques alone. Noting the historical context of an object can help identify if a blue dye is indigo, as in the case of the Peruvian textile fragment. But sometimes it is necessary to use more sophisticated analytical techniques for identification. For example, a boro farmer’s coat from Japan, made of mostly blue garment discards (Figure 10.1–2), was created in 1920. By then, Japan had already opened up to global trade, and the maker possibly had access to nonindigo blue dyes.8 However, it is believed to be constructed mostly with garment discards from the Edo period (1603–1868), which means that native indigo-dyed fabric is probably the most prevalent type of material.9 The IRFC image of this boro coat is difficult to read, as most of the material shows some degree of infrared reflectance. Another noninvasive means to check for the presence of indigo in this case is fiber optics reflectance spectroscopy (FORS).
FORS yields graphs, or spectra, of the intensity of electromagnetic radiation reflected by a spot probed on an object, across a selected range of wavelengths chosen for the investigation.10 If we observe this spectrum around the 400–900nm wavelength range, we can see features characteristic of indigo. In the FORS spectrum obtained from the dark stripe in the twentieth-century skirt, there is a low reflectance in most of the visible region apart from the violet-blue range (400–485nm), where it is slightly higher (Figure 11). A much higher reflectance appears in the infrared region after a steep increase at around 700nm. The area under the curve in each region shows how bright the probed spot will look in its corresponding reflectance image. The smaller area of this curve in the visible region corresponds to the dark appearance of the indigo stripe in Figure 2. The larger area under the curve in the infrared region corresponds to the bright appearance of the same stripe in Figure 3.
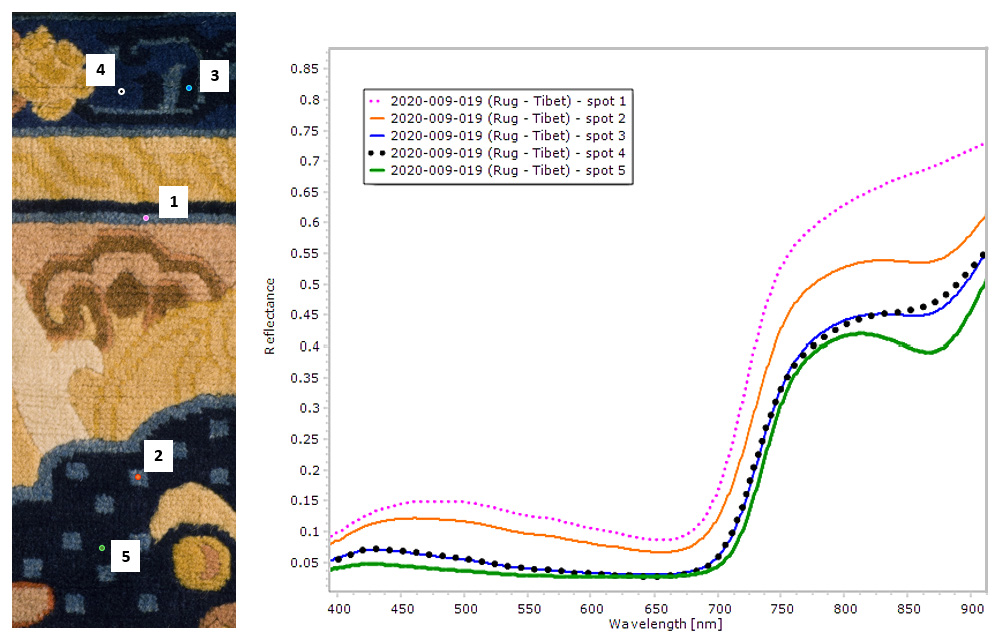
These spectra can vary in shape, just as IRFC images can vary in appearance, depending on the concentration of indigo in the probed spot and the background on which it was applied. A woolen rug from Tibet helps illustrate this beautifully. FORS spectra of spots dyed in various shades of blue show slight differences that follow previously studied trends relating to varying concentrations of indigo, while maintaining the shape typical of indigo’s reflectance spectra (Figure 12).11
Understanding how to interpret these spectra can help determine if the garment discards in the boro farmer’s coat were dyed with indigo. FORS testing on various parts of the coat, like the sleeve and torso, yielded indigo-typical spectra, but the collar’s reflectance spectrum was relatively different, displaying a more gradual rise into the infrared region (Figure 13). This difference is enough to conclude that the colorant is not pure indigo and was either a completely different dye or a mixture of dyes that may have included indigo, resulting in a color with the observed spectrum. When combined with the observation that the collar is made of velvet rather than the cotton used in most of the boro coat, questions arise about its addition. Was the collar part of the original design? Or was it added after acquisition?
This short study shows that cultural context and scientific analysis complement one another, each aspect enabling a better interpretation of the other. Combining these approaches reveals fascinating insights into the economic value and cultural significance of indigo, as well as the impact of these factors on the use of this dye in material culture. Interpreting the results of the technical analysis not only provides important insights but also presents an exciting avenue for delving into the inherent properties of indigo. Traditionally, scientific dye identification has involved complex and destructive methods like chromatography, which uses dye extracted chemically from the textile, a process that is not always feasible for museum objects. Factors like cost, accessibility, and rarity of the object in question can limit such testing. In these cases, the noninvasive analytical methods highlighted in this essay are useful alternatives, playing a crucial role in preserving the physical integrity of the objects while simultaneously yielding illuminating results.
Acknowledgments
I am grateful to Barbara Hanson Forsyth, Caitlin Podas, Emily Brown, and Nicole Bagley for their assistance with preparing objects for imaging.
Notes
-
Robert Christie, Colour Chemistry (London: Royal Society of Chemistry, 2001); Dominique Cardon, Natural Dyes: Sources, Tradition, Technology and Science (London: Archetype, 2007). ↩︎
-
Antonino Cosentino, “Infrared Technical Photography for Art Examination,” e-Preservation Science 13 (2016): 1–6. ↩︎
-
Christina Bisulca and Christopher Foster, “Perfection of Wisdom—a Spectroscopic and Microscopic Analysis of a Twelfth-Century Buddhist Sūtra,” Bulletin of the Detroit Institute of Arts 92, nos. 1–4 (2018): 68. ↩︎
-
Marie-Claire Quiquemelle, “Tissus et broderies Miao de la province du Guizhou en Chine,” Arts Asiatiques 59 (2004): 101–25. ↩︎
-
Joanne Dyer, Giovanni Verri, and John Cupitt, “Multispectral Imaging in Reflectance and Photo-Induced Luminescence Modes: A User Manual,” online European CHARISMA Project, 2013; Antonino Cosentino, “Identification of Pigments by Multispectral Imaging: A Flowchart Method,” Heritage Science 2 (2014), https://doi.org/10.1186/2050-7445-2-8; Neville Agnew, ed., Conservation of Ancient Sites on the Silk Road: Proceedings of the Second International Conference on the Conservation of Grotto Sites, Mogao Grottoes, Dunhuang, People’s Republic of China, June 28–July 3, 2004 (Los Angeles: Getty Conservation Institute, 2010), http://hdl.handle.net/10020/gci_pubs/2nd_silkroad; Diego Tamburini and Joanne Dyer, “Fibre Optic Reflectance Spectroscopy and Multispectral Imaging for the Non-Invasive Investigation of Asian Colourants in Chinese Textiles from Dunhuang (7th–10th Century AD),” Dyes and Pigments 162 (2019): 494–511, https://doi.org/10.1016/j.dyepig.2018.10.054. ↩︎
-
E. K. Webb, Rebecca Summerour, and Jennifer Giaccai, “A Case Study Using Multiband and Hyperspectral Imaging for the Identification and Characterization of Materials on Archaeological Andean Painted Textiles,” Textile Group Postprints 24 (2014): 23–36. ↩︎
-
Samuel Whittaker, “Photo-Induced Fluorescence Imaging to Characterize and Map Natural Organic Colorants” (master’s diss., Courtauld Institute of Art, London, 2013); Moupi Mukhopadhyay, “An Almost Transparent Blue: A Study of the Photophysical Properties of Indigo Pigment in Infrared Radiation” (master’s diss., Courtauld Institute of Art, London, 2019). ↩︎
-
“Japan—Meiji Restoration, Isolationism, Trade” (by Fred G. Notehelfer), https://www.britannica.com/place/Japan/The-opening-of-Japan. ↩︎
-
“Boro Farmer’s Coat,” Mingei International Museum website, https://mingei.org/collections/textiles. ↩︎
-
J. Striova, A. Dal Fovo, and R. Fontana, “Reflectance Imaging Spectroscopy in Heritage Science,” La Rivista del Nuovo Cimento 43, no. 10 (2020): 515–66, https://doi.org/10.1007/s40766-020-00011-6. ↩︎
-
Mukhopadhyay, “An Almost Transparent Blue.” ↩︎
Bibliography
- Agnew 2010
- Agnew, Neville, ed. Conservation of Ancient Sites on the Silk Road: Proceedings of the Second International Conference on the Conservation of Grotto Sites, Mogao Grottoes, Dunhuang, People’s Republic of China, June 28–July 3, 2004. Los Angeles: Getty Conservation Institute, 2010, http://hdl.handle.net/10020/gci_pubs/2nd_silkroad.
- Bisulca 2018
- Bisulca, Christina, and Christopher Foster. “Perfection of Wisdom—a Spectroscopic and Microscopic Analysis of a Twelfth-Century Buddhist Sūtra.” Bulletin of the Detroit Institute of Arts 92, nos. 1–4 (2018), https://doi.org/10.1086/701459.
- Cardon 2007
- Cardon, Dominique. Natural Dyes: Sources, Tradition, Technology and Science. London: Archetype, 2007.
- Christie 2001
- Christie, Robert. Colour Chemistry. London: Royal Society of Chemistry, 2001.
- Cosentino 2014
- Cosentino, Antonino. “Identification of Pigments by Multispectral Imaging: A Flowchart Method.” Heritage Science 2 (2014), https://doi.org/10.1186/2050-7445-2-8.
- Cosentino 2016
- Cosentino, Antonino. “Infrared Technical Photography for Art Examination.” e-Preservation Science 13 (2016): 1–6.
- Dyer 2013
- Dyer, Joanne, Giovanni Verri, and John Cupitt. “Multispectral Imaging in Reflectance and Photo-Induced Luminescence Modes: A User Manual.” Online European CHARISMA Project, 2013.
- Mukhopadhyay 2019
- Mukhopadhyay, Moupi. “An Almost Transparent Blue: A Study of the Photophysical Properties of Indigo Pigment in Infrared Radiation.” Master’s diss., Courtauld Institute of Art, London, 2019.
- Quiquemelle 2004
- Quiquemelle, Marie-Claire. “Tissus et broderies Miao de la province du Guizhou en Chine.” Arts Asiatiques 59 (2004): 101–25.
- Striova 2020
- Striova, J., A. Dal Fovo, and R. Fontana. “Reflectance Imaging Spectroscopy in Heritage Science.” La Rivista del Nuovo Cimento 43, no. 10 (2020): 515–66, https://doi.org/10.1007/s40766-020-00011-6.
- Tamburini 2019
- Tamburini, Diego, and Joanne Dyer. “Fibre Optic Reflectance Spectroscopy and Multispectral Imaging for the Non-Invasive Investigation of Asian Colourants in Chinese Textiles from Dunhuang (7th–10th Century AD).” Dyes and Pigments 162 (2019): 494–511, https://doi.org/10.1016/j.dyepig.2018.10.054.
- Webb 2014
- Webb, E. K., Rebecca Summerour, and Jennifer Giaccai. “A Case Study Using Multiband and Hyperspectral Imaging for the Identification and Characterization of Materials on Archaeological Andean Painted Textiles.” Textile Group Postprints 24 (2014): 23–36.
- Whittaker 2013
- Whittaker, Samuel. “Photo-Induced Fluorescence Imaging to Characterize and Map Natural Organic Colorants.” Master’s diss., Courtauld Institute of Art, London, 2013.